
In the previous lesson, you learned that unit sales, prices and costs affect profit. This time, we will use those relationships to make a simple estimate of revenue and cash for the next 3 years.
A table of estimates like this is called a model. A model is not a machine that predicts the future. It is a calculation sheet that shows what result follows from which assumptions, and what changes when those assumptions change.
First, check the scope of the actual numbers
When you build a model, check past revenue, operating income and cash flow in the company's filings. Revenue is the amount earned from selling products and services, and operating income is what remains after the related cost of sales and operating expenses are subtracted from the revenue of the core business.
Operating margin is the share of revenue that operating income makes up. If revenue is 1,000 and operating income is 100, the margin is 100 ÷ 1,000 × 100 = 10%. Even when revenue grows, this ratio can fall if costs rise faster.
When you copy past numbers, make sure the fiscal year, the currency and the units of each table match. Even for the same company, one table may be in millions of dollars and another in thousands of dollars. Your results only mean something if you check the figures and accounting standards in the actual filings before entering them.
Estimate a hypothetical company's revenue for 3 years
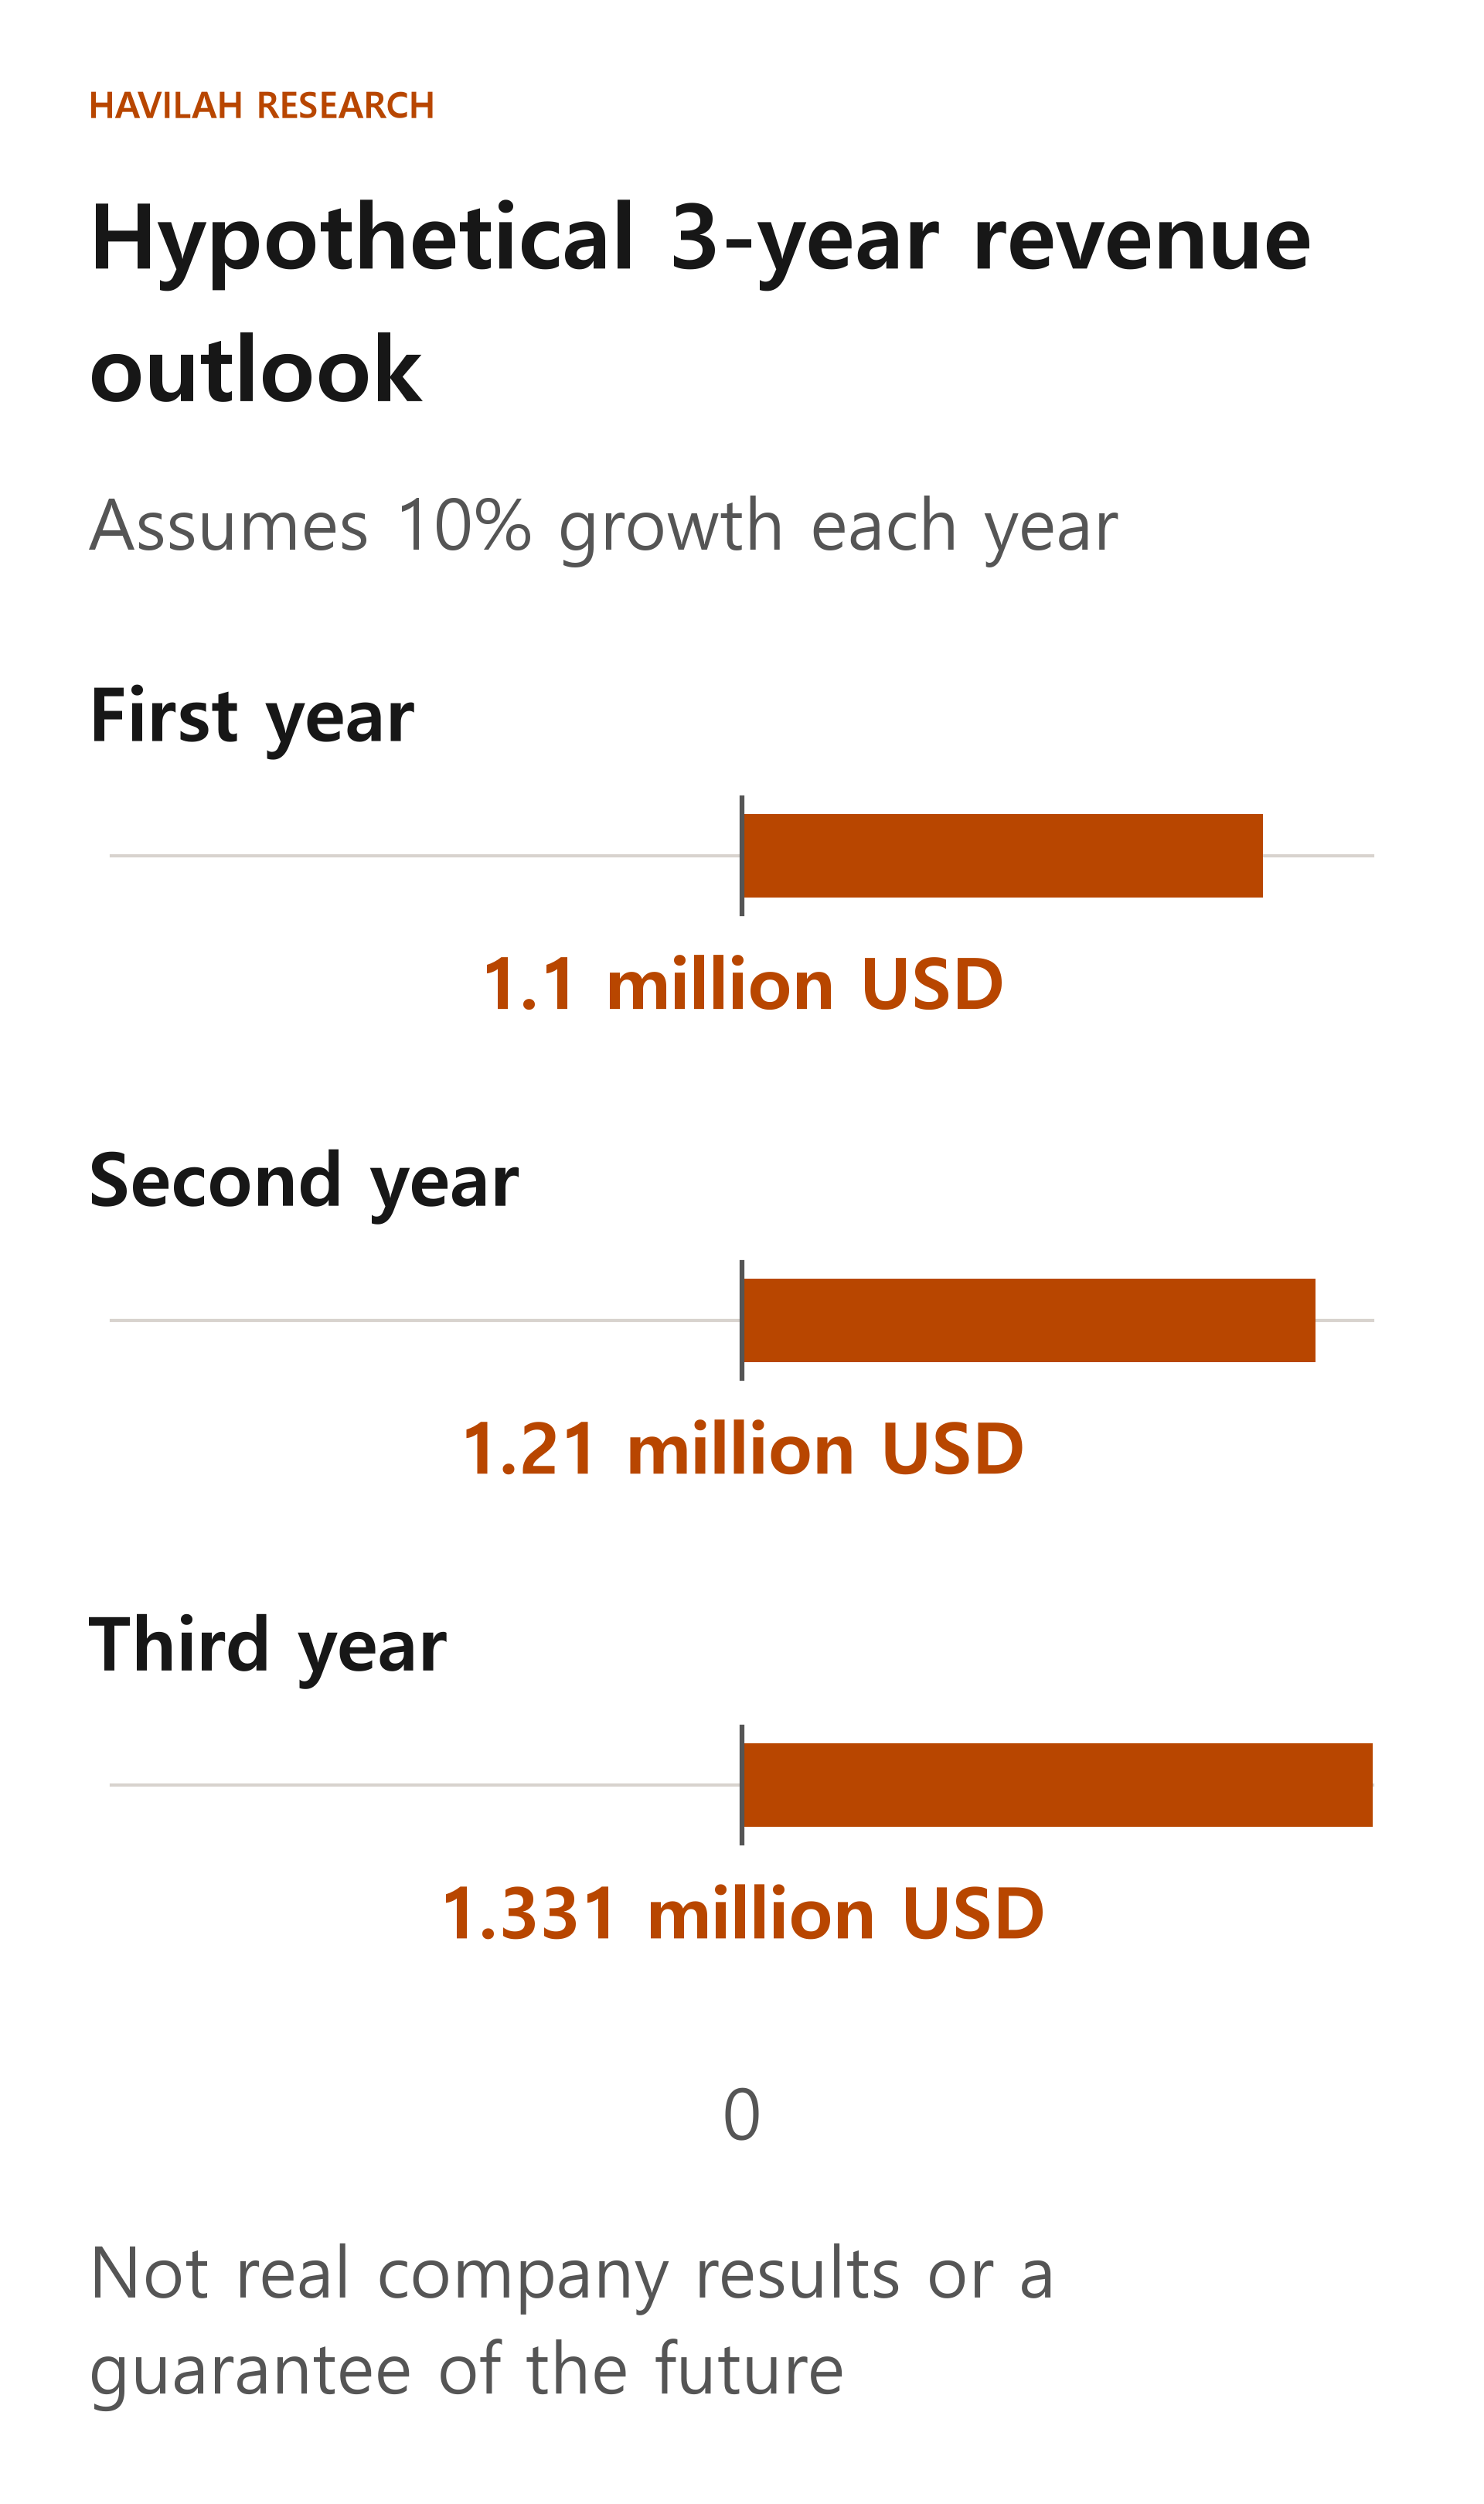
From here on, this is a hypothetical example, not a real company. For convenience, all amounts are shown in thousands of dollars: $1,000 thousand is the same as $1 million. Assume revenue was $1,000 thousand in the most recent year and will grow by 10% every year. This assumption is not a forecast; it is a number for learning the calculation.
Revenue in the first year is 1,000 × 1.10 = $1,100 thousand. The second year applies 10% again to the first-year amount, so it is 1,100 × 1.10 = $1,210 thousand. The third year is 1,210 × 1.10 = $1,331 thousand.
| Item | First-year estimate | Second-year estimate | Third-year estimate |
|---|---|---|---|
| Revenue | 1,100 | 1,210 | 1,331 |
| Operating margin | 10% | 10% | 10% |
| Operating income | 110 | 121 | 133.1 |
The amounts in the table are in thousands of dollars. Operating income in the first year is 1,100 × 10% = $110 thousand. In the same way, in the third year it is 1,331 × 10% = $133.1 thousand.
The revenue growth rate and operating margin are held constant only to keep the calculation simple. In reality, unit sales, prices, product mix and costs can change every year.
Profit and cash are different
Profit and cash flow are not the same number.
Even if a company sells a product and records a profit, no cash has come in yet if the customer has not paid for it. Conversely, when it buys equipment, the cash goes out first, but the accounting expense may be spread over several years. This is called depreciation.
Depreciation has already been counted as an expense in operating income, but recording that expense does not mean the same amount of cash goes out again at that moment. When you look at the movement of cash in a simple way, you add depreciation back and subtract the money actually spent buying equipment separately.
When the money tied up in operations grows, for example because amounts owed by customers and inventory increase, the cash available to use right away can shrink compared with the profit on the books. In this example, assume the additional money tied up in operations is $10 thousand each year.
Calculate first-year cash step by step
To keep the calculation simple, assume there is no debt, no interest and no other non-operating gains or losses, and that a hypothetical tax rate of 20% applies to operating income. Each year's operating income already includes $20 thousand of depreciation as an expense. The money actually spent on equipment is $30 thousand each year. Assume the tax and the increase in money tied up in operations are paid out in cash in the same year, and that there are no other non-cash items and no other changes in working capital.
| First-year item | Calculation | Thousand USD |
|---|---|---|
| Operating income | 1,100 × 10% | 110 |
| After hypothetical tax | 110 × (1 − 20%) | 88 |
| Add back depreciation | 88 + 20 | 108 |
| Subtract additional money tied up in operations | 108 − 10 | 98 |
| Subtract equipment purchases | 98 − 30 | 68 |
In this simple example, the cash left over in the first year is $68 thousand. Applying the same assumptions gives $76.8 thousand in the second year and $86.48 thousand in the third. These are numbers for learning, calculated by treating tax, depreciation, money tied up in operations and equipment spending separately.
A real company may have further items, such as interest, debt repayments, share issuance, acquisitions and the timing of tax payments. You should not read the numbers above as money shareholders could receive right away. Look at the actual cash flow statement and notes in a way that fits the purpose of your analysis.
How do the results change if the assumptions change?
If revenue grows more slowly than expected or the operating margin shrinks, the outlook for operating income and cash changes too. The cash left over right away can also shrink if equipment spending rises to expand production or if customers pay later.
So rather than trusting a single number, it is better to calculate a base case and a worse case together. Write down whether each assumption is based on past results, the company's plans or industry conditions. Mark the parts with weak support as estimates.
In the next lesson, we will use cash outlooks like this to estimate the value of a company, and see how much the result changes when you put in different assumptions.