
When a company's revenue grows, you cannot immediately say that its competitive strength has improved. The whole market may have grown, or the company may have sold more by cutting prices. To tell these reasons apart, you need to look beyond the company at its customers, competitors and suppliers.
In this lesson, we will boil a complex industry down to one page of questions and look at how changes in it flow through to a company's revenue and profit.
Start with what the company sells
First, write one sentence answering "Who are this company's customers, and why do they pay?" The important questions differ depending on whether the customers are individuals or other businesses. For a company that sells products to individuals, you need to look at buyers' tastes and how sensitive they are to price. For a company that supplies parts to other businesses, its customers' investment plans and supply contracts may matter.
Even when an industry grows, not every company grows equally. Separate two questions: did revenue rise because the whole market grew, or did the company's revenue grow faster than the whole market, over the same scope and period, so that its market share rose? Market share is the portion of the total market that one company accounts for. If you define the market's scope or the measurement period wrongly, the comparison will change too.
Look at customers and competitors together
Consider a hypothetical water purifier company, Company A. Even if Company A wants to raise its prices, that may be hard if there are many similar products and customers can easily choose another one. On the other hand, if it offers features or convenient services that customers value, it may be able to avoid price competition to some extent. To find out which is actually the case, you need to look at customers' choices and competitors' products.
Competitors are not only companies that make similar products. If customers can solve the same problem another way, that is also an alternative. For example, buying bottled water instead of using a water purifier can be an alternative for a customer. This is a simplified hypothetical case for illustration; it does not describe the market share or profitability of any real market.
Check together whether demand across the industry is growing, whether customers can easily switch to other products, and how competitors are changing their prices and features. Even if the market grows, fierce competition can leave a company with less profit than expected.
If supply gets stuck, sales can get stuck too
Suppose Company A gets a key filter from only a few suppliers. If filters run short, it may be unable to make its products on time even when orders are plentiful. A point that limits total production like this is called a bottleneck. If filter prices rise, the cost of the products it sells can rise as well.
The fact that there are few suppliers does not by itself prove that problems will arise. The impact depends on whether the company has secured alternative suppliers, whether it has enough inventory and whether it can pass price increases on to customers. And depending on whether the supplier also sells the same part to competitors, the impact may spread across the whole industry.
Check the supply risks described in the company's reports together with the actual changes in inventory and revenue and the company's explanations. It is also important to separate forecasts about the industry from what the company has already experienced.
Profit can fall even when unit sales rise
The numbers below are a hypothetical example to aid understanding. Assume Company A sells only one type of product and consider only the cost of making it. Administrative expenses, taxes, interest and other costs are left out.
| Item | Last year | This year |
|---|---|---|
| Units sold | 100,000 units | 110,000 units |
| Selling price per unit | $50 | $48 |
| Product cost per unit | $35 | $37 |
Last year's revenue was 100,000 units × $50 = $5,000,000. This year it is 110,000 units × $48 = $5,280,000. Unit sales rose, but the price per unit fell. Revenue grew by $280,000, an increase of about 5.6%.
Now let us also calculate gross profit, what is left after subtracting the cost of the products. Last year it was 100,000 units × ($50 − $35) = $1,500,000. This year it is 110,000 units × ($48 − $37) = $1,210,000.
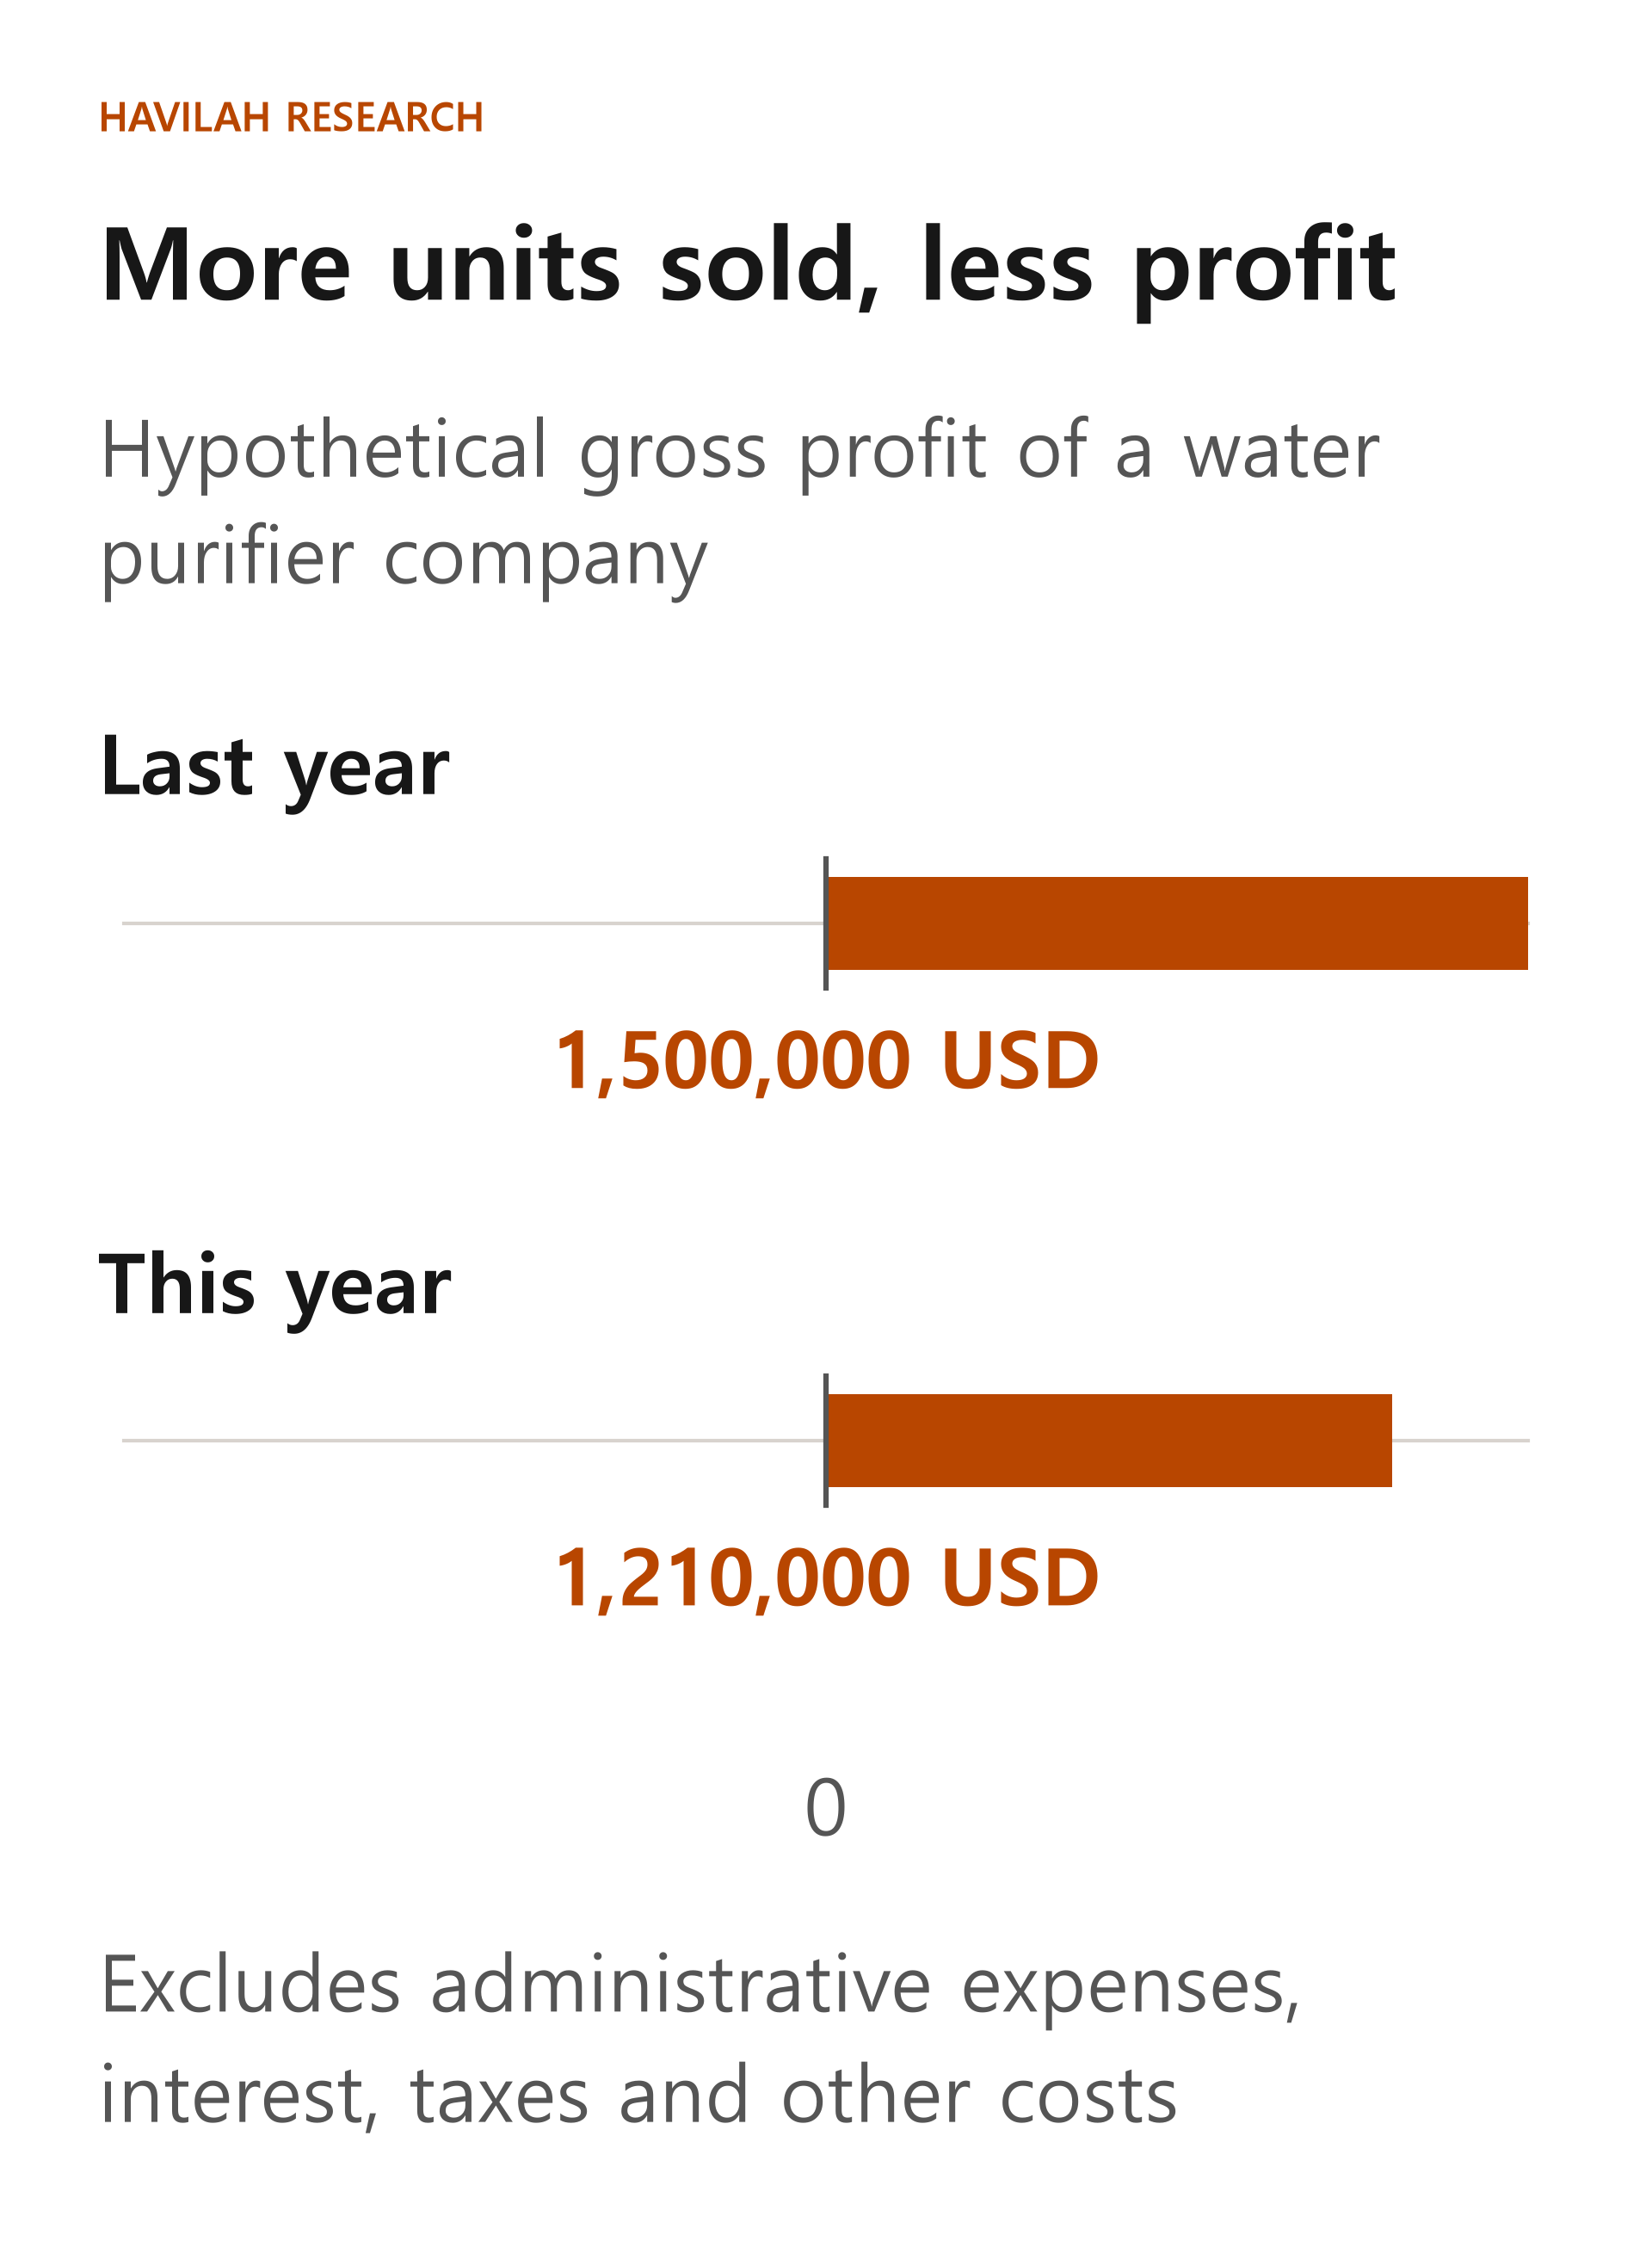
Gross profit fell by $290,000, about 19.33% less than last year. Even though the company sold more products, the price fell and the cost rose, so the amount left on each unit became smaller.
This calculation rests on the simple assumption that the selling price and cost stay constant. A real company sells many products, and each can have a different price and cost. Gross profit is also calculated before administrative and other expenses are subtracted, so it should not be read as net income.
Sum it up on one page and note the next questions
When you study a company, try writing its customers, competitors, suppliers, unit sales, prices and costs on one page. Then draw arrows showing how each one could flow through to revenue and profit.
For example, you might write "competitor discounts → possible fall in selling price → possible drop in profit per unit." The arrows here are not settled predictions but hypotheses to check. Higher unit sales might partly offset the lower price, or costs might fall at the same time and change the result.
Finally, write down what you do not know yet and the conditions that would change your mind. In the next lesson, we will use the revenue and cost drivers found this way to turn future results into some simple numbers.