
Once you have chosen a company to analyze, where should you start reading? Before collecting the summaries that show up in search results, it is better to look at the reports the company filed itself. That way you can check, even for the same number, which period and which company it covers and what explanation comes with it.
You do not need to memorize hundreds of pages from the start. Find the parts that describe the business, the risks and the results, and read what you need one step at a time.
First, confirm the company and the report
On EDGAR, the filing system of the U.S. Securities and Exchange Commission (SEC), you can search by company name or ticker. In the search results, check not only the company name but also the date each report was filed and the period it covers. The date a report's figures refer to and the date the filing was made public can differ.
The main reports of U.S. domestic listed companies are the following.
| Report | What to check in it |
|---|---|
| 10-K | The business, risks and financial statements for one fiscal year |
| 10-Q | Quarterly results and changes in financial position |
| 8-K | Important events that meet set reporting requirements |
Foreign private issuers may file on different forms, such as the 20-F annual report and the 6-K report. Do not assume that every company uses the same forms; look at its actual list of filings.
If "/A" appears after a report's name, it may be an amendment to an earlier report. Check the original report and the changes together. Also, the latest document was not necessarily available at the past point in time you are analyzing.
Where to start reading in a long annual report
The business description in the 10-K is the starting point for understanding what products and services the company provides. In the risk factors, look at the risks the company describes as important, such as competition, regulation and dependence on particular customers or suppliers.
Management's discussion of results gives the reasons the company offers for why the numbers changed. Remember that this is the company's own explanation, and check it together with the actual numbers in the financial statements and other sources. The financial statements show revenue and expenses, the assets and liabilities the company holds, and the cash that came in and went out.
Not every company is exposed to the same risks to the same degree. A long list of risk factors does not mean they will all happen soon. Ask how each risk could affect revenue, costs, cash or shareholders' rights.
Find one number in a real report
As an example, let us look at Apple's 10-K for fiscal 2025. This is practice in reading a real filing from a specific point in time; it does not represent the latest results or an investment recommendation. This fiscal year ended on September 27, 2025.
The unit shown in the report's table of results by products and services is millions of U.S. dollars. Services revenue was $96,169 million in fiscal 2024 and $109,158 million in fiscal 2025. Total revenue for fiscal 2025 was $416,161 million.
| Apple filing item | Fiscal 2024 | Fiscal 2025 |
|---|---|---|
| Services revenue | $96,169 million | $109,158 million |
| Total revenue | $391,035 million | $416,161 million |
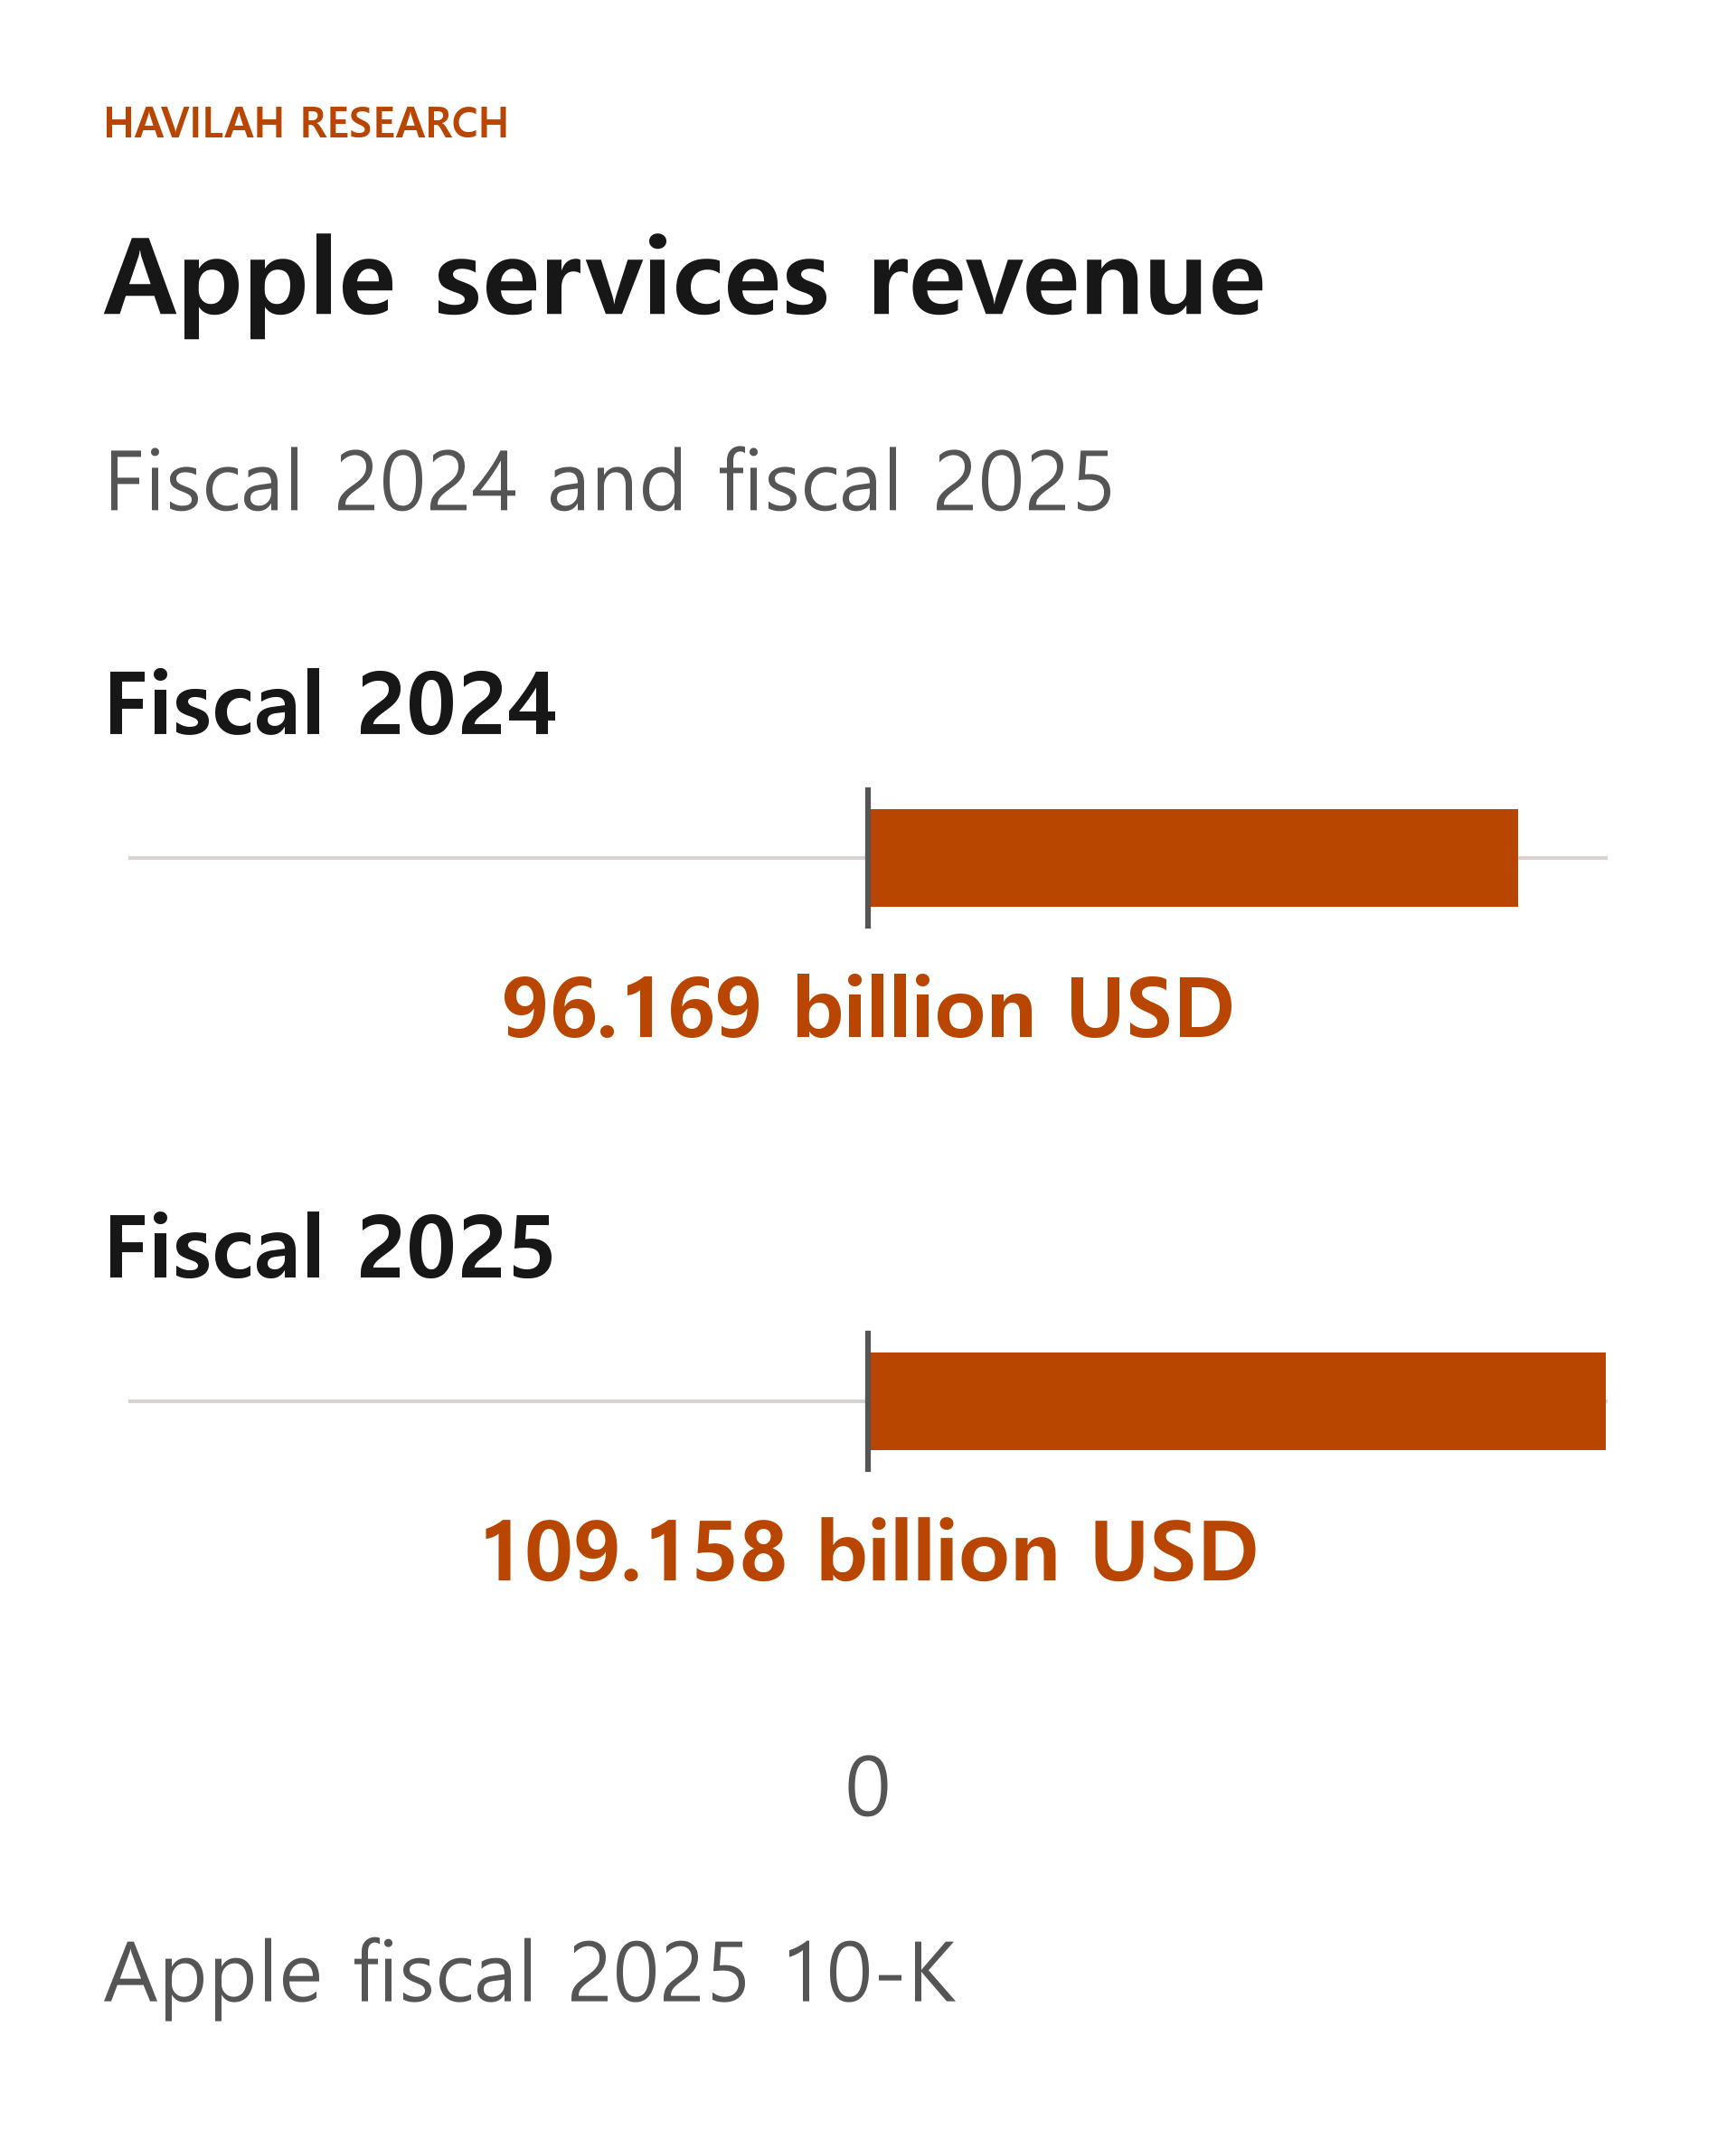
The increase in services revenue in fiscal 2025 was 109,158 − 96,169 = $12,989 million. The growth rate is calculated against the previous year's services revenue.
12,989 ÷ 96,169 × 100 = about 13.51%
The share of total revenue that services made up in the same year is 109,158 ÷ 416,161 × 100 = about 26.23%. The growth rate and the share of total revenue answer different questions, and they have different denominators.
The fact that services revenue grew does not by itself mean that services profit grew at the same rate. Revenue is the amount of sales, while profit is what remains after the related costs are subtracted. The filing gives growth in advertising, the App Store and cloud services, among other things, as reasons for the increase in services revenue in fiscal 2025. When you record this explanation, also note that these are the factors the company itself stated.
When you copy a number, write down five things with it
Next to each number, note the company name, the type of report, the period covered, the unit and where the item appears. For example, if you write "Apple, fiscal 2025 10-K, table of results by products and services, millions of USD," it will be easy to go back to the original later.
Even when two companies both say "2025," their fiscal years can end on different dates. One table may show three months of revenue and another a full year. Consolidated financial statements combine the company and certain subsidiaries, so check the scope when you compare them with the figures for the parent company alone.
Separate the facts you checked from your own views
Writing "services revenue was $109,158 million" in your journal records a fact you checked in the filing. "It will keep growing at the same pace" is a separate forecast. To test whether that forecast holds, you need to look further at competition, prices, customer numbers, costs and new filings.
Rather than deciding whether to buy after reading a single report, write down the questions you want answered. For example, you can check what services revenue is made up of, and which of the risks the company describes could affect this business.
In the next lesson, we will look at the company's industry and competitors together, and connect them to the factors that drive its revenue.