
If you made ten trades and won seven of them, is that a good strategy? You cannot tell from the number of wins alone. If you make a little when you win and lose a lot when you lose, your money can shrink even with a high win rate.
When you look at investment performance, check not only how often you won but also how much you made when you won and how much you lost when you lost.
You can lose money even after winning seven times
The following are hypothetical trades for illustration. Suppose you made $10 every time you won and lost $30 every time you lost. Commissions and taxes are left out to keep the calculation simple.
| Result | Number of trades | Amount per trade | Total |
|---|---|---|---|
| Gain | 7 | $10 | $70 |
| Loss | 3 | -$30 | -$90 |
| Overall | 10 | — | -$20 |
Since 7 of the 10 trades were winners, the win rate is 70%. But the overall result is $70 - $90 = -$20. Even with a high win rate, overall performance can be poor if each loss is large.
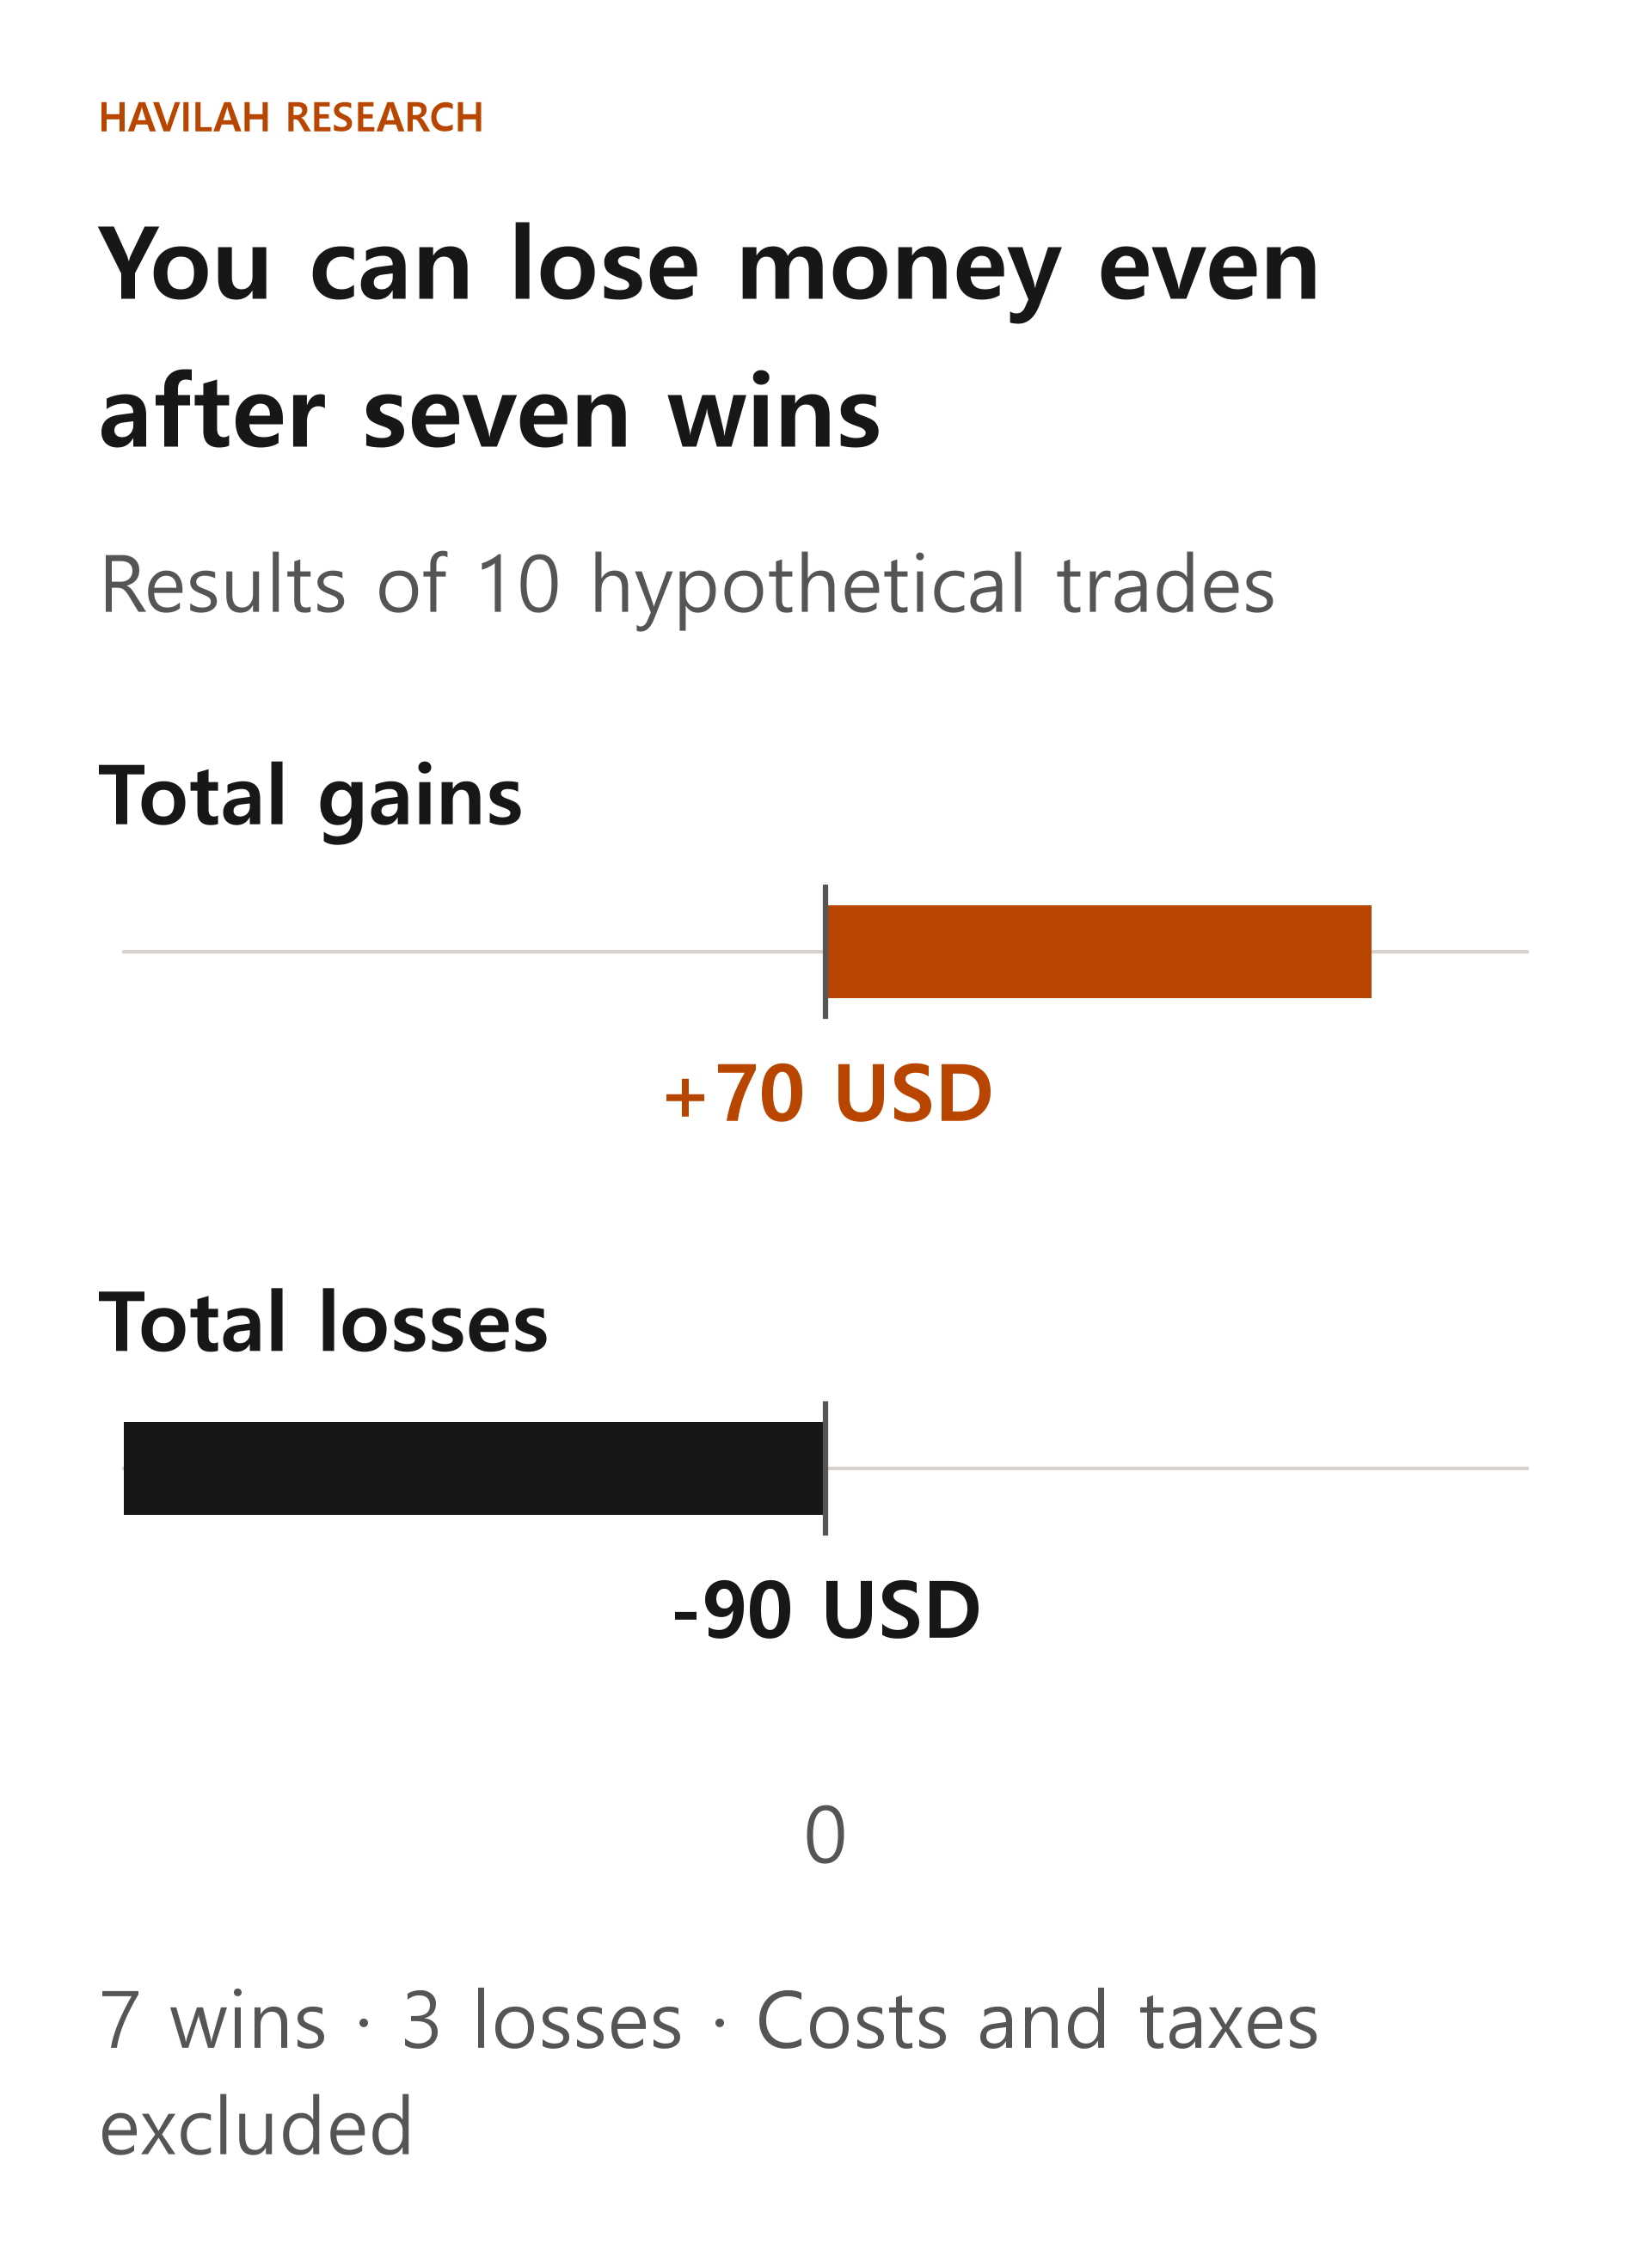
If you divide this case by its 10 trades, the average result per trade is -$20 ÷ 10 trades = -$2. This does not mean the same conditions will repeat in the future. It is only a number that summarizes 10 past hypothetical trades.
Look at the win rate together with the payoff ratio
The payoff ratio is the average gain divided by the size of the average loss. In the case above, the average gain is $10 and the size of the average loss is $30, so the payoff ratio is 10 ÷ 30 = about 0.33. The minus sign on a loss shows its direction, so when you calculate the ratio, you use the size of the loss, $30.
If you look at the win rate together with the average gain and loss, you can also calculate the expected value per trade. The expected value is the average result you would expect from one trade, assuming the same probabilities and amounts apply.
If you assume that the results of the hypothetical case above are the probabilities, the calculation is as follows.
0.7 × $10 - 0.3 × $30 = -$2
This is the same as the result you got earlier by dividing the total gain or loss by the number of trades. In real investing, however, the size of the gain or loss on the next trade is different every time. There is also little reason to believe that the win rate over ten past trades equals the probability in the future. Including trading costs can change the result.
Also check how long the return took
If $1,000 became $1,210 after 2 years, the total return is 21%. But you should not read this as earning 21% every year. That is because of compounding: the money earned in the first year also grows in the following year.
Assuming there were no deposits or withdrawals, converting this into the same rate of growth each year gives 10%, because $1,000 × 1.10 × 1.10 = $1,210. A rate that converts the start and end of a whole period into a constant annual growth rate like this is called the compound annual growth rate, or CAGR.
This does not mean the investment actually rose 10% every year. Even if it lost money one year and rose sharply the next, the start and end could be the same. For an account where money was added or withdrawn along the way, simply comparing the starting and ending amounts makes it hard to measure the performance of the investment itself accurately.
Also check whether the loss was one you could bear
Suppose your investment grew from $1,000 to $1,200 and then fell to $900. Measured from the peak of $1,200, the fall is $300.
$300 ÷ $1,200 × 100 = 25%
How far the value fell from an earlier peak to a later low, as here, is called the drawdown. The largest drawdown during the period you observed is called the maximum drawdown, or MDD. In the example above, assuming there was no bigger fall in any other stretch, the maximum drawdown is 25%.
To get from $900 back to $1,200, the value has to rise by $300. This time the base is $900, so the rise needed is about 33.33%. Falling 25% and then rising 25% is not enough to get back to the original peak.
The maximum drawdown can differ depending on the period you look at and how often prices were recorded. A past maximum fall of 25% does not mean you will not see a bigger loss in the future.
The Sharpe ratio: returns and swings together
Two strategies may have the same return, yet one may have swung far more than the other. The Sharpe ratio is a measure that takes the average return over a period, subtracts the risk-free return for the same period, and divides the result by how much the returns swung. The risk-free return is an interest rate used as a benchmark, and the swings are usually expressed as a number called the standard deviation of returns.
For example, if the average annual return is 8%, the benchmark interest rate is 2% and the standard deviation of annual returns is 12%, the Sharpe ratio is (8% - 2%) ÷ 12% = 0.5. These numbers are assumptions for illustration, not the performance of a real product.
When you compare different strategies, use returns over the same period and measured at the same frequency, and the same risk-free rate. The Sharpe ratio alone cannot tell you about every risk. For strategies where large losses happen rarely, or where returns are skewed to one side, it is especially important to look at other risk measures as well.
What should you look for in a real performance report?
First check whether the win rate is shown alongside the average gain and the average loss. Next, look at the period behind the total return, how deposits, withdrawals and dividends were handled, and whether commissions and taxes are included. CAGR, maximum drawdown and the Sharpe ratio are only meaningful when you compare them over the same period and under the same conditions.
A profitable result alone does not prove that the process was good. In the next lesson, we will look at how to review your decisions by recording the thinking you set out before buying and the actual results of your trades.