
A share price rose from $100 to $105. If you bought at $100 and sold at $105, that is a 5% gain. But a real order may not be filled at exactly the price you saw on the screen, and every trade can also come with costs. The smaller the return you expect, the more this difference matters.
The bid, the ask and the spread
A stock trading screen usually shows two prices. The bid is the price at which someone is offering to buy, and the ask is the price at which someone is offering to sell. The difference between the highest bid and the lowest ask is called the spread.
For example, if the bid is $99.90 and the ask is $100.10, the spread is $0.20. The midpoint between the two prices is $100. An investor who wants to buy right away and pays $100.10 is paying $0.10 more than the midpoint. At the same quotes, someone who sells right away receives $99.90, which is $0.10 less than the midpoint. In other words, $0.20 is the whole gap between the two quotes, and $0.10 is the gap between the midpoint and one side's quote in this example. The actual fill price can be better or worse, depending on the order and market conditions.
Slippage and how orders actually get filled
The price can move between the moment you place an order and the moment it reaches the market. The difference between the reference price you expected and the price at which your order is actually filled is called slippage. A purchase may be filled at a higher price than you expected, or a sale at a lower one, but a fill can also turn out in your favor.
A market order aims for a quick trade but does not guarantee the fill price. A limit order lets you set a limit on the price at which you buy or sell, but it may not be filled if no one will trade with you at that price. That is why you need to look at the order type together with the stock's trading volume.
The quantity offered at the lowest ask may also be smaller than the number of shares you want to buy. For example, suppose only 5 shares are offered at $100.10, and 5 more shares are offered at the next price, $100.20. If no other orders change and your order for 10 shares is filled at both prices, you buy 5 shares at $100.10 and the other 5 at $100.20. The average fill price is $100.15. This is a hypothetical case for illustration, and real orders can be filled differently.
If your order is large compared with the quantity available to trade in the market, your order itself can move the price against you. This is called market impact. The actual effect depends not only on the size of the order but also on trading volume and market conditions at the time.
A limit order caps the price, but it does not guarantee a fill. Even if your chosen price appeared on the chart, your order may be filled only in part, or not at all, because of orders already waiting ahead of yours or the quantity available to trade.
How trading costs affect your return
The following is a hypothetical case to help you understand. Assume you buy 10 shares at once and later sell them all. Taxes and currency conversion are left out. The trading commission is $1 each time, both when you buy and when you sell. There are no dividends.
| Item | When buying | When selling |
|---|---|---|
| Midpoint of the quotes | $100 | $105 |
| Unfavorable gap from midpoint to quote | $0.10 per share | $0.10 per share |
| Additional unfavorable fill gap | $0.05 per share | $0.05 per share |
| Assumed actual fill price | $100.15 | $104.85 |
If you calculate with midpoints only, you buy 10 shares for $1,000 and sell them for $1,050. The gain is $50, and the return on the starting amount is 5%.
If you include the fill prices and commissions, buying costs $100.15 × 10 shares + $1 = $1,002.50. After selling, you receive $104.85 × 10 shares - $1 = $1,047.50.
So the gain is 1,047.50 - 1,002.50 = $45. Using the amount you actually spent as the denominator, the return is 45 ÷ 1,002.50 × 100 = about 4.49%.
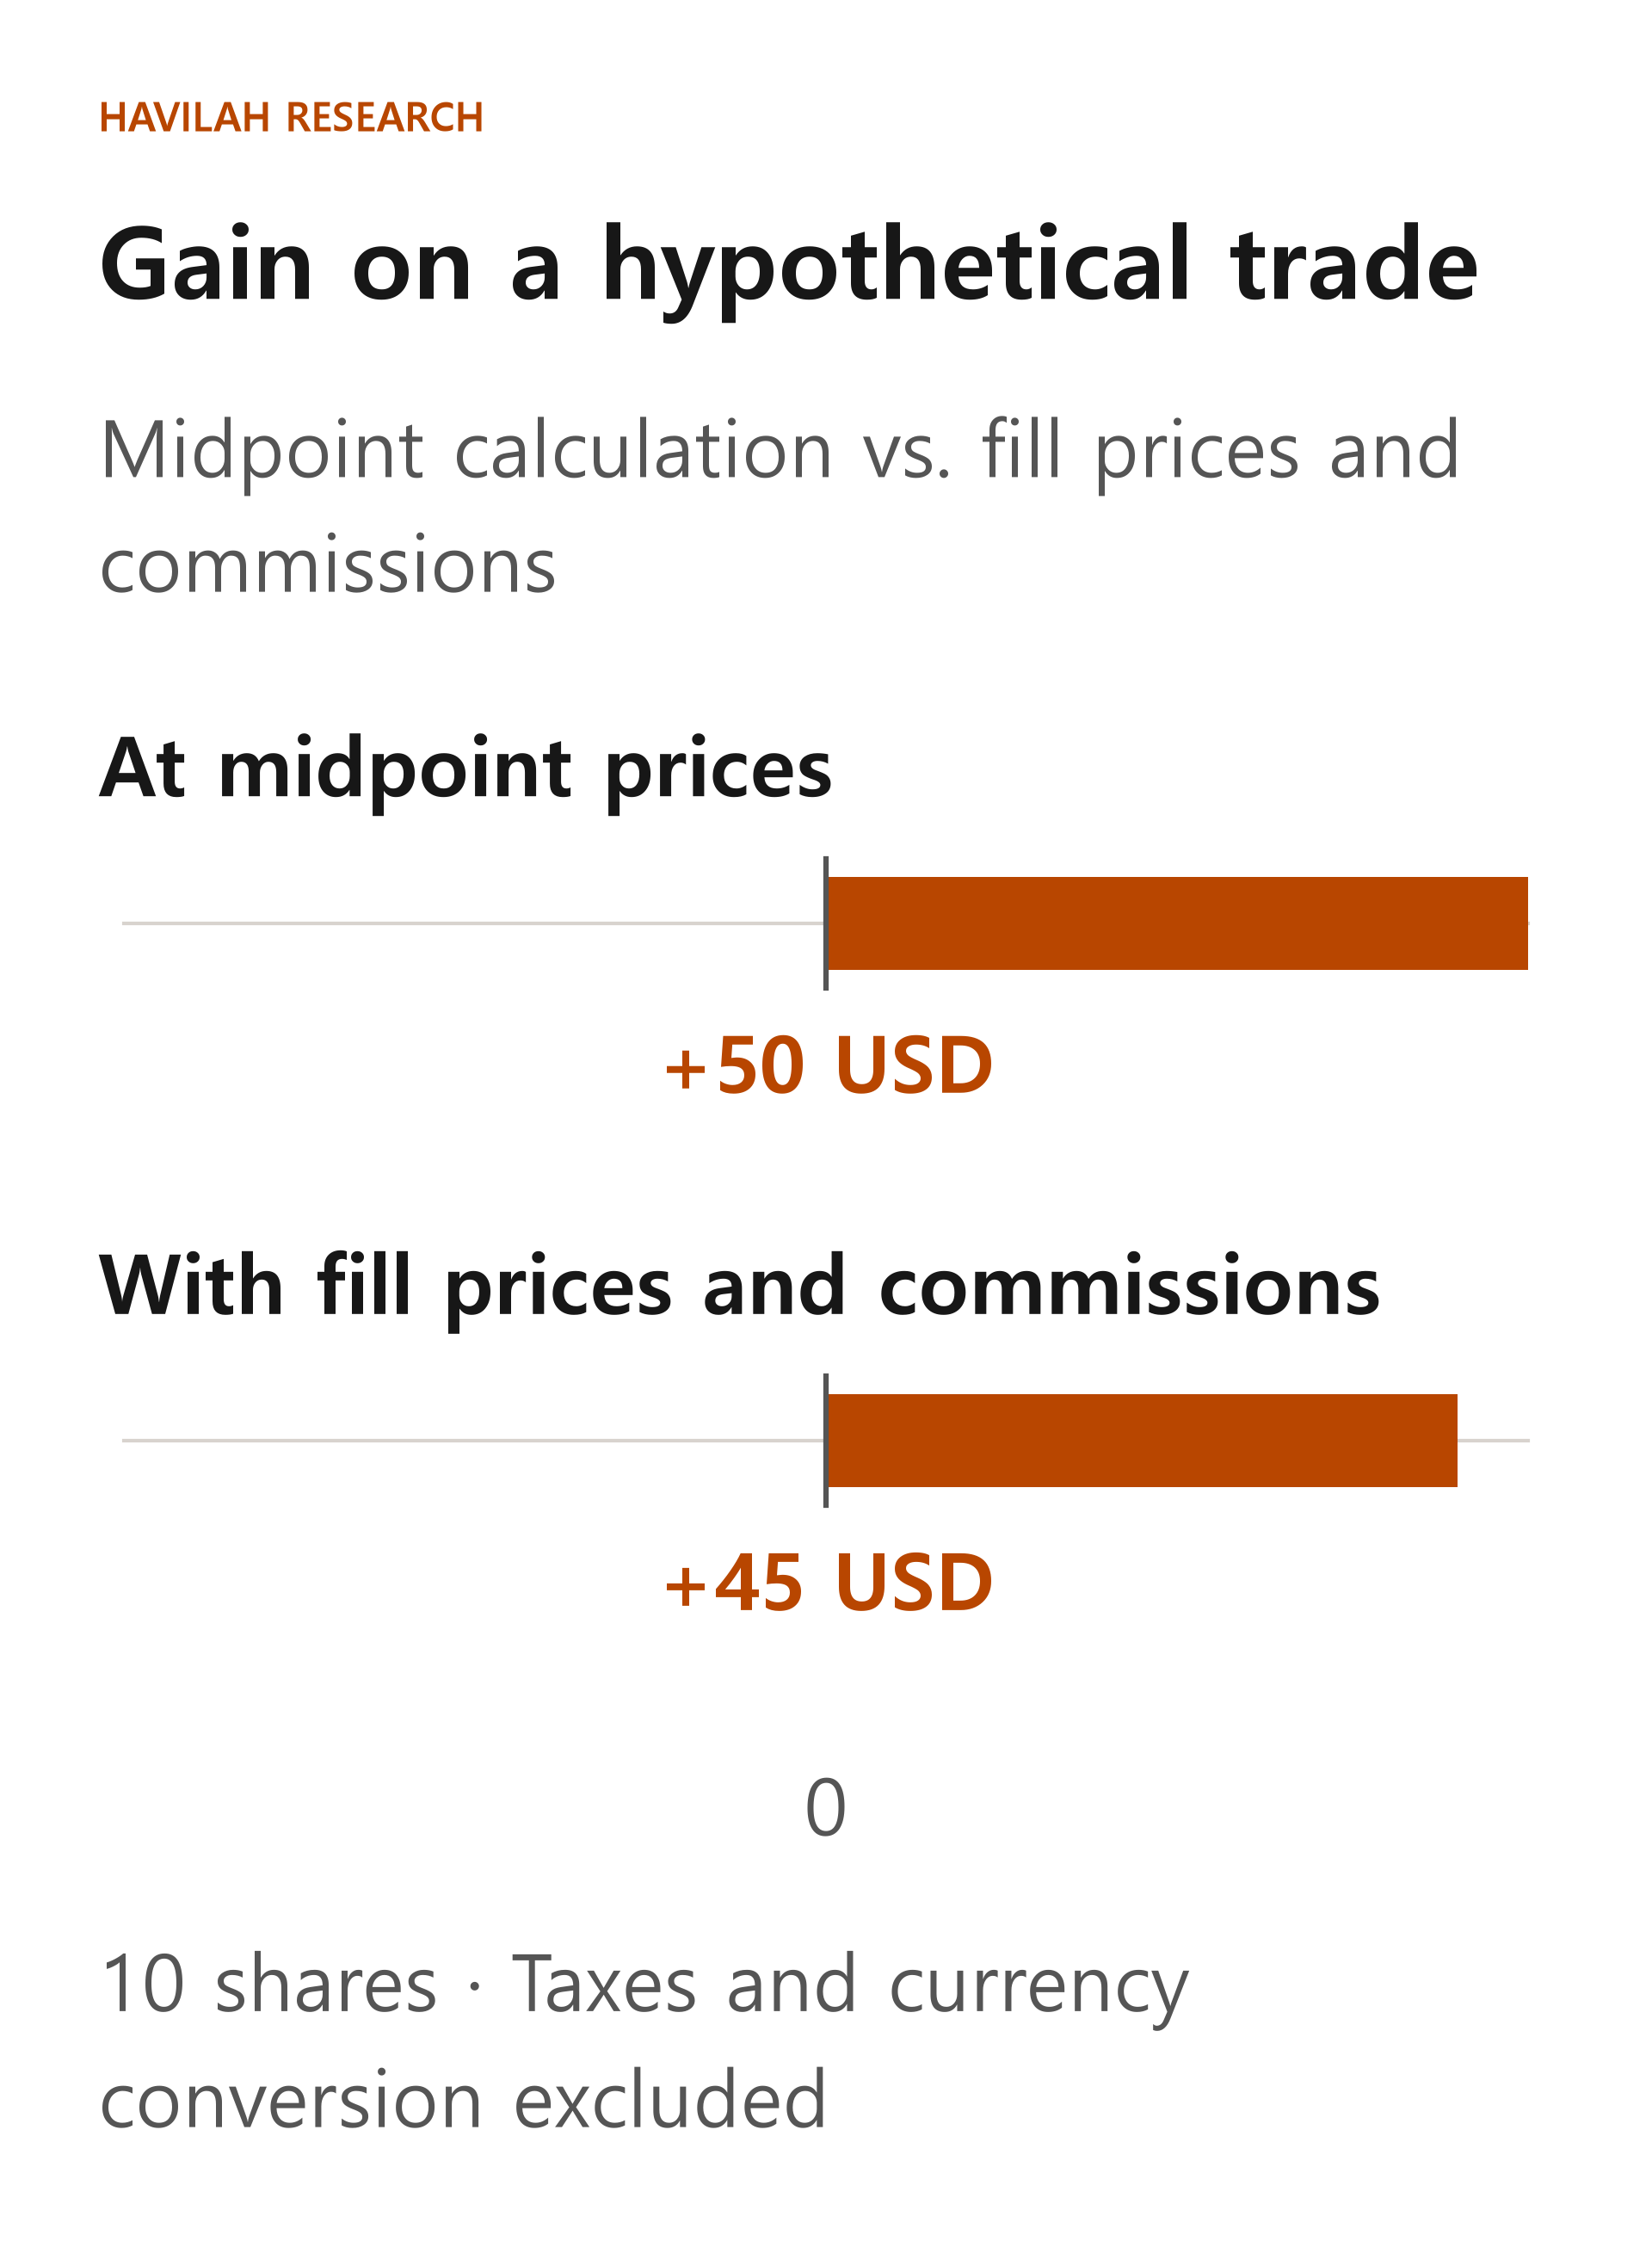
Compared with the $50 gain at midpoint prices, the gain is $5 smaller. That $5 is 10% of the theoretical $50 gain. Of it, the gap between the midpoint and the quoted prices accounts for $2 on both sides combined, the additional fill gap for $1 and commissions for $2. The quote gap and the fill gap are already reflected in the fill prices, so if you subtract them again as if they were commissions, you count the costs twice.
These numbers are not costs that always arise in real markets. For a stock that trades easily, the gaps can be small; when trading is thin or prices move sharply, they can be larger. The hypothetical example assumes only unfavorable fills, but in reality favorable fills are also possible.
Exchange rates, conversion costs and taxes
If you invest in foreign stocks with money in your home currency, the stock's return in dollars and your return converted into your home currency can differ. Changes in the exchange rate can increase or reduce your return on foreign investments. The actual conversion price may include a conversion fee, so check the exchange rate applied and whether any discount on the conversion fee is available to you.
Tax can vary depending on where you live, the type of account, the product, and whether your gains and losses are combined with other trades. The 4.49% in this lesson is a hypothetical pre-tax return in dollars. Do not read it as your actual after-tax return in your home currency. For the taxes that apply now and how to report them, check the official guidance of the country where you are taxed and the terms of your own account.
Comparing backtests with real-world results
First check whether a table of past performance includes trading costs. Also check when orders were placed, whether the closing price or the midpoint was used as the fill price, and whether there was really enough quantity to trade at that price. With frequent trading, the same costs can pile up many times.
A backtest is a way of applying investment rules to past data and looking at the results. In a backtest, the time when you can know about a signal and the time when you can place an order may differ.
For example, if a strategy's buy signal is confirmed only after the final closing price is known, it is hard to assume that the order was filled at that day's closing price, which has already passed. You need to look separately at the next point when you could actually place an order, and at the price at that time. A strategy whose signal and order are finalized before the close, and which meets the requirements for orders at the close under that trading method, needs to be assessed separately.
Nor should you assume that the quantity you wanted was filled just because your limit price appeared on a past chart. If the data makes it hard to know the queue of waiting orders and the quantities traded, you need to note the limitation that it is uncertain whether orders would have been filled. If you separate when the signal is confirmed, when the order is submitted, the prices and quantities at which it could be filled and how unfilled orders are handled, you can better understand the gap between past results and real-world trading.
When you compare strategies, the comparison is not fair if you subtract commissions from only one of them or include currency conversion in only one. Match the period, the currency, dividends, commissions and fill assumptions, and also check how orders that did not trade were handled.
For example, should you subtract the spread again from the $45 gain calculated with the actual buy and sell fill prices? No. That gap is already included in the fill prices, so subtracting it again would count it twice. Account separately only for items that are not yet included, such as commissions.
In the next lesson, we will interpret a strategy's performance by looking at the win rate together with the average gain and loss.