
Two investment strategies made the same amount of money. But if one saw the account shrink by 10% along the way and the other saw it shrink by 50%, the investor would have lived through two very different experiences.
The final return alone does not tell you how large a fall you had to sit through in between. The number to look at here is the maximum drawdown, or MDD.
How far has it come down from the peak?
A drawdown is how far a value has fallen from its previous peak to where it is now. If the peak was $100 and the value is now $80, it has fallen $20, and the drawdown from the peak is 20%.
The maximum drawdown is the largest such fall from a peak within a given period. You do not find it by picking prices in any order, such as an earlier low and a later high, and comparing them. You must compare a peak with a low that came after it.
Let's follow an account's movements
The following are the values of a hypothetical account. Assume there are no additional deposits or withdrawals, and that the values on the dates shown are compared in the same currency. Dividends, costs and taxes are not taken into account.
| Step | Account value | Highest value so far | Decline from the highest value |
|---|---|---|---|
| 1 | $10,000 | $10,000 | 0% |
| 2 | $12,000 | $12,000 | 0% |
| 3 | $9,000 | $12,000 | -25% |
| 4 | $10,500 | $12,000 | -12.5% |
| 5 | $8,400 | $12,000 | -30% |
| 6 | $12,600 | $12,600 | 0% |
At the third step, the account fell from $12,000 to $9,000, so the drawdown is 3,000 ÷ 12,000 = 25%. At the fourth step, it partly recovered to $10,500 but did not go above the earlier high of $12,000. So the peak used as the reference is still $12,000.
At the fifth step, the account fell by 12,000 - 8,400 = $3,600, so the drawdown is 3,600 ÷ 12,000 = 30%. Across the six valuation points shown, the maximum drawdown observed is 30%. It is often written as -30% to show that it is a loss.
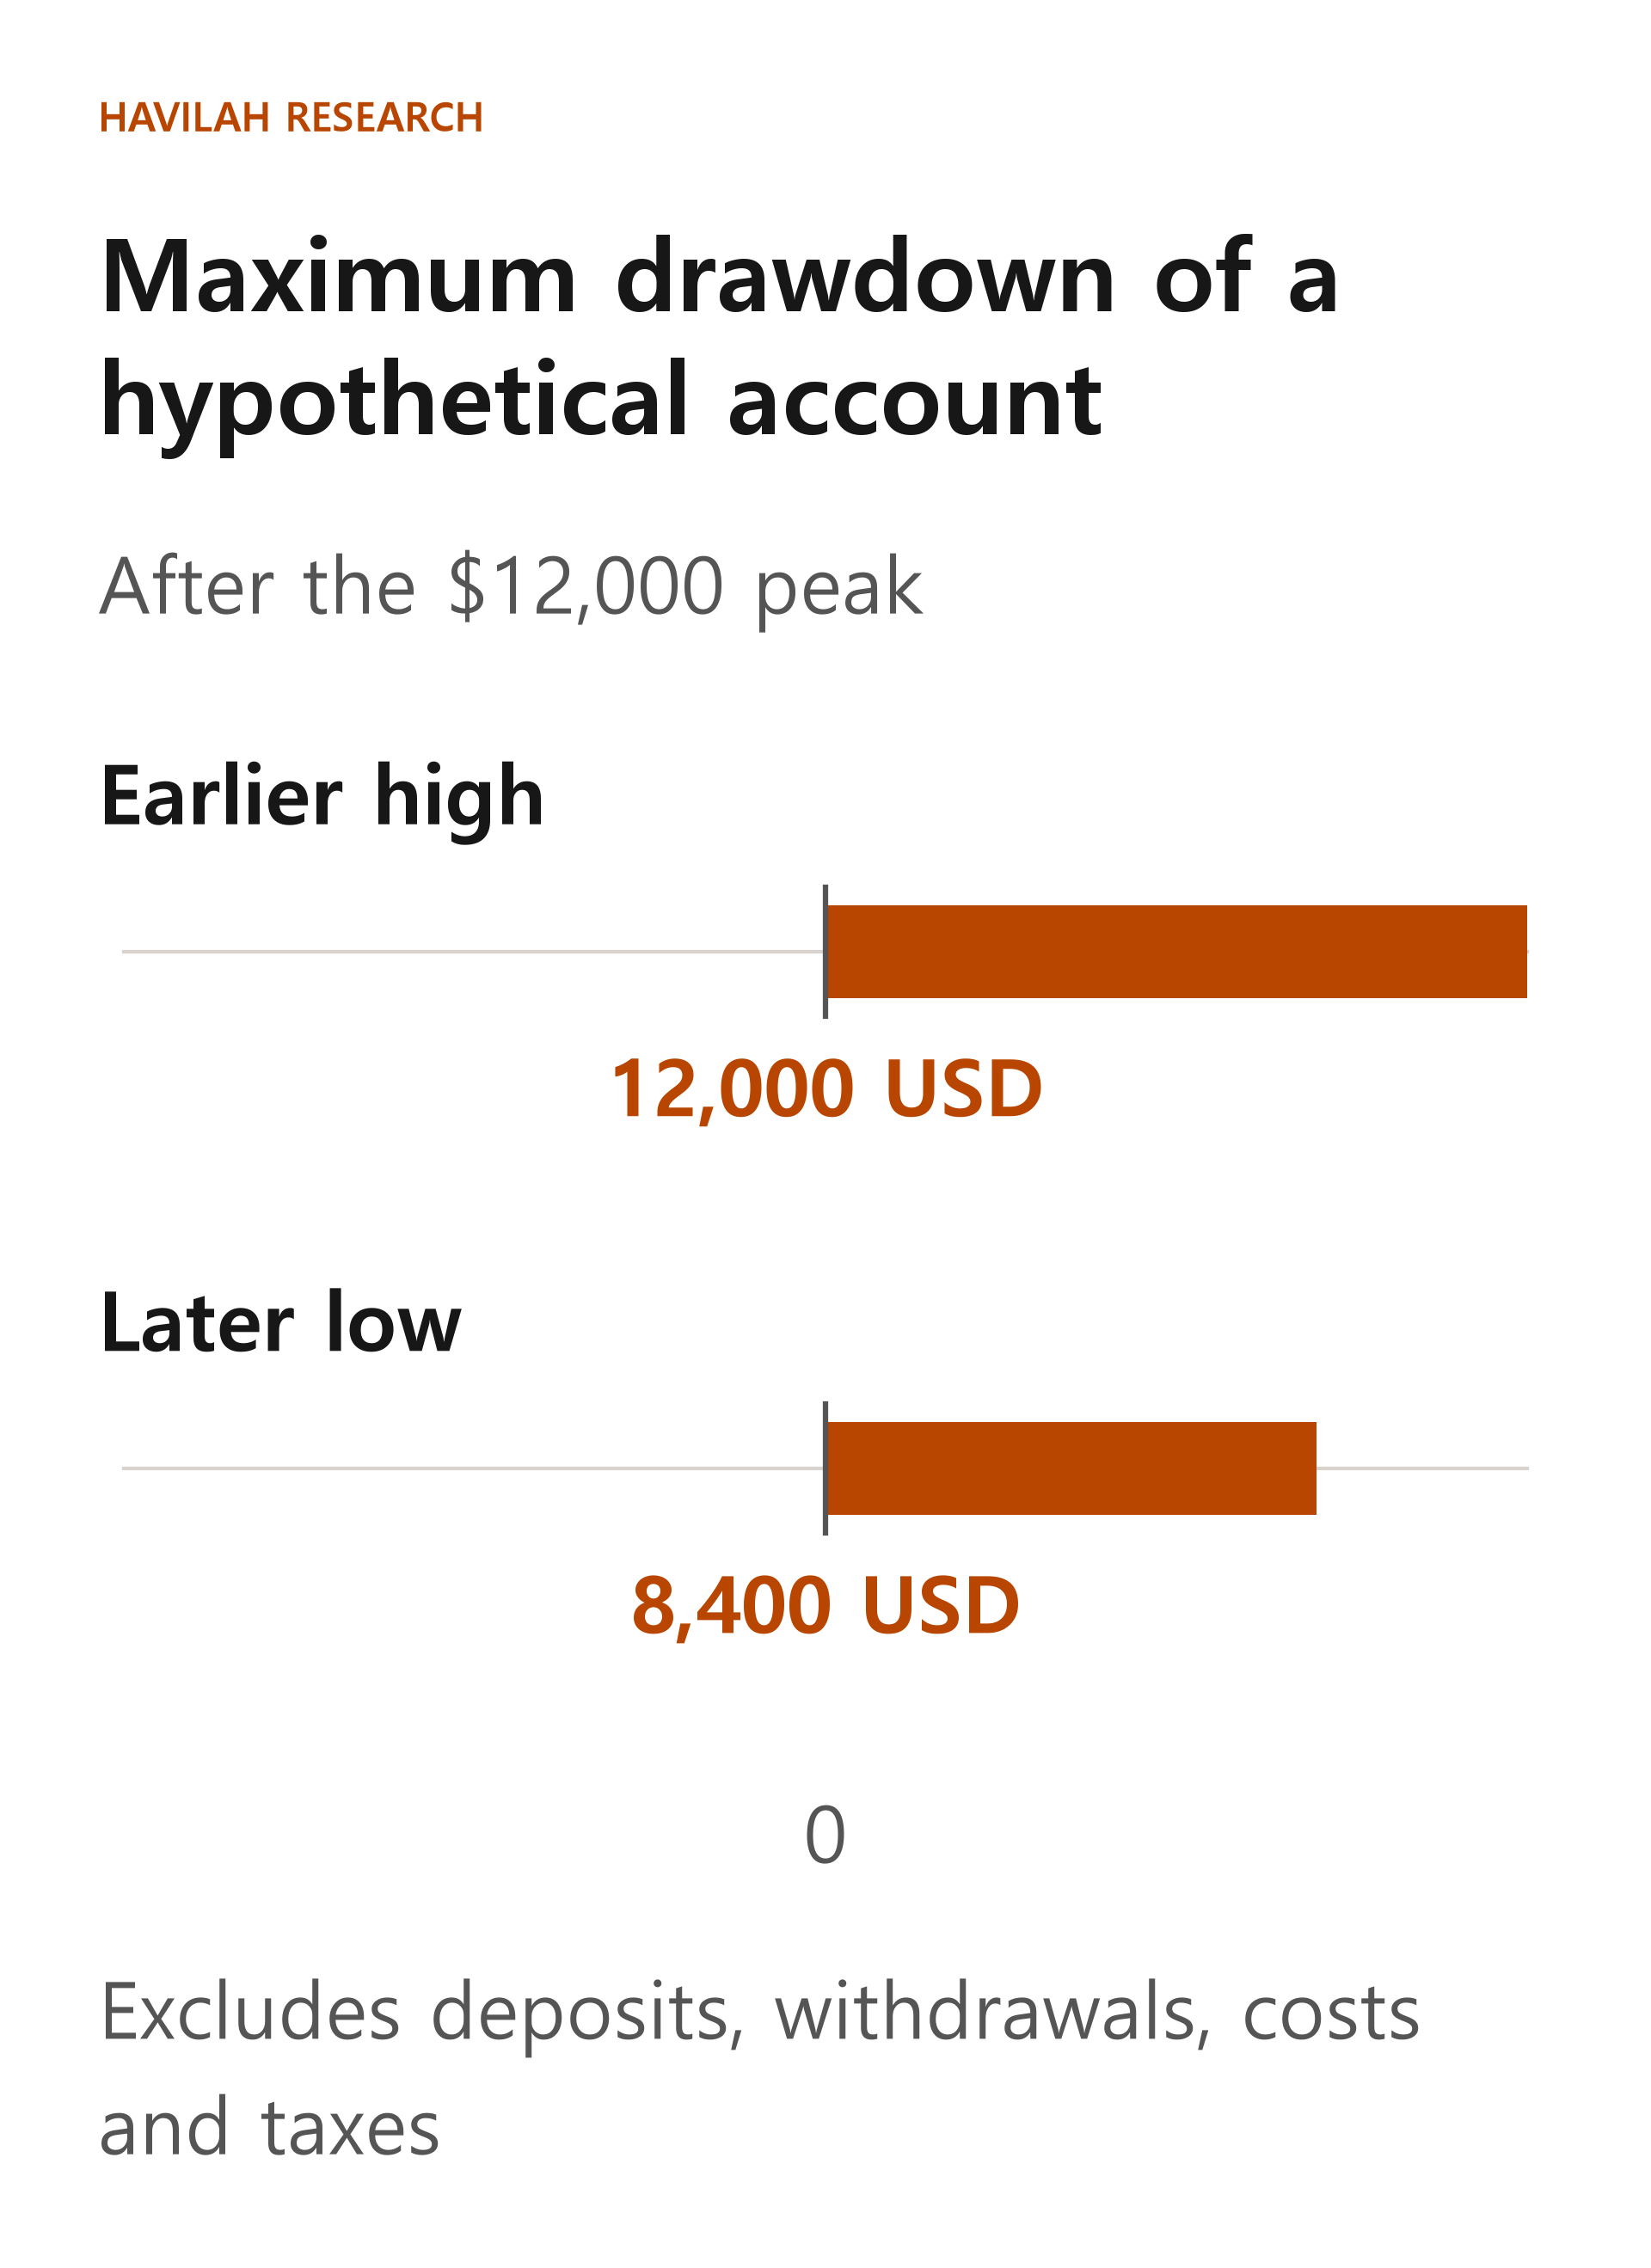
At the sixth step, the account rises to $12,600 and passes its earlier peak, so the drawdown at that point returns to 0%. But the 30% maximum drawdown observed across these six points does not disappear, because the largest fall you have already been through stays in the record. The cumulative return from the starting $10,000 to the final $12,600 is (12,600 - 10,000) ÷ 10,000 = 26%. Even when the final return is positive, you may have gone through a large drawdown along the way.
Why do you need more than a 30% gain after a 30% loss?
For $8,400 to get back to $12,000, it has to grow by $3,600. Now the gain is measured from the $8,400 that is left, so it is 3,600 ÷ 8,400 × 100 = about 42.86%.
On the way down, the base was $12,000; on the way up, the base is $8,400. Because the base amount has shrunk, the percentage gain needed to return to the original peak is larger. The example in Lesson 185, where a 50% loss needs a 100% gain to recover, follows the same principle.
This calculation assumes that only the account's value changes and no new money is put in. If you added money and the balance reached $12,000, the balance would be back, but you could not conclude that the investment itself had recovered its loss.
Points that are easy to miss when you compare the numbers
First, match the time periods. One strategy's 1-year maximum drawdown and another strategy's 10-year maximum drawdown are not a like-for-like comparison. Depending on the day the calculation starts, it may also leave out an earlier peak.
How often the value is measured also matters. If you use only daily closing prices, you will not see moves in which the price fell further during the day and then recovered. The drawdown observed in the data shown can differ from the drawdown you actually went through during the day.
If there are additional deposits or withdrawals, it is hard to compare investment performance using the account balance alone. For example, if you withdraw $1,000 and your balance falls, that is not an investment loss. In such cases, look separately at a series of returns adjusted for those cash flows, and check how it is calculated. Whether dividends and taxes are included can also affect the result. Also check how fees are treated, and whether figures are measured in your home currency or in U.S. dollars.
How can you use it when you make investment decisions?
When you look at a maximum drawdown, check not only how far the value fell but also how long it stayed below the earlier peak. Even with the same 30% fall, the strain on the investor is different when the account recovers soon and when it fails to recover for years.
A past maximum drawdown is only the result observed over that period, not a limit on future losses. Consider it together with your position weights, the cash you need for living expenses and whether you can stick to your plan during a decline. In the next lesson, we will look at how to bring your portfolio back in line when market moves have shifted the weights you first set.