
You bought three different stocks, and one day all of them fell. They are different companies, so why does this happen?
A share price reflects both the company's own circumstances and events that affect many companies at once. Let's go a step beyond counting how many stocks you own and look at which changes could shake your account all at the same time.
Different companies can share the same risk
Imagine three companies: one designs semiconductors, one makes chipmaking equipment and one manufactures chips. Their businesses differ, but all three are affected by investment in the semiconductor industry and by customer orders. If customers cut back on investment in new facilities, the sales outlook for all three companies can worsen together.
A cause like this, which affects several investments at the same time, is called a common factor. Examples include the economy, interest rates, exchange rates, commodity prices and demand in a particular industry. Still, the same news does not act on every company in exactly the same way. If their contracts, customers and financial condition differ, their share prices can react differently too.
In Lesson 179, we calculated whether the same company shows up both in the stocks you own and inside your ETFs. This time, we look at how losses can happen at the same time because of common factors, even when the companies are different.
When they fall together on the same news
The following is a hypothetical example, not the returns of real companies or markets. You invested $3,000 in each of three stocks, $9,000 in total. Assume that over the same period A fell 20%, B fell 15% and C fell 10%. Dividends, exchange rates, trading costs and taxes are left out.
| Stock | Starting amount | Assumed return | Change in value | Ending value |
|---|---|---|---|---|
| A | $3,000 | -20% | -$600 | $2,400 |
| B | $3,000 | -15% | -$450 | $2,550 |
| C | $3,000 | -10% | -$300 | $2,700 |
The total loss is 600 + 450 + 300 = $1,350. That is 15% of the full $9,000, so the ending value is $7,650. You spread your money across three stocks, but in this scenario all of them fell, so the account as a whole lost money.
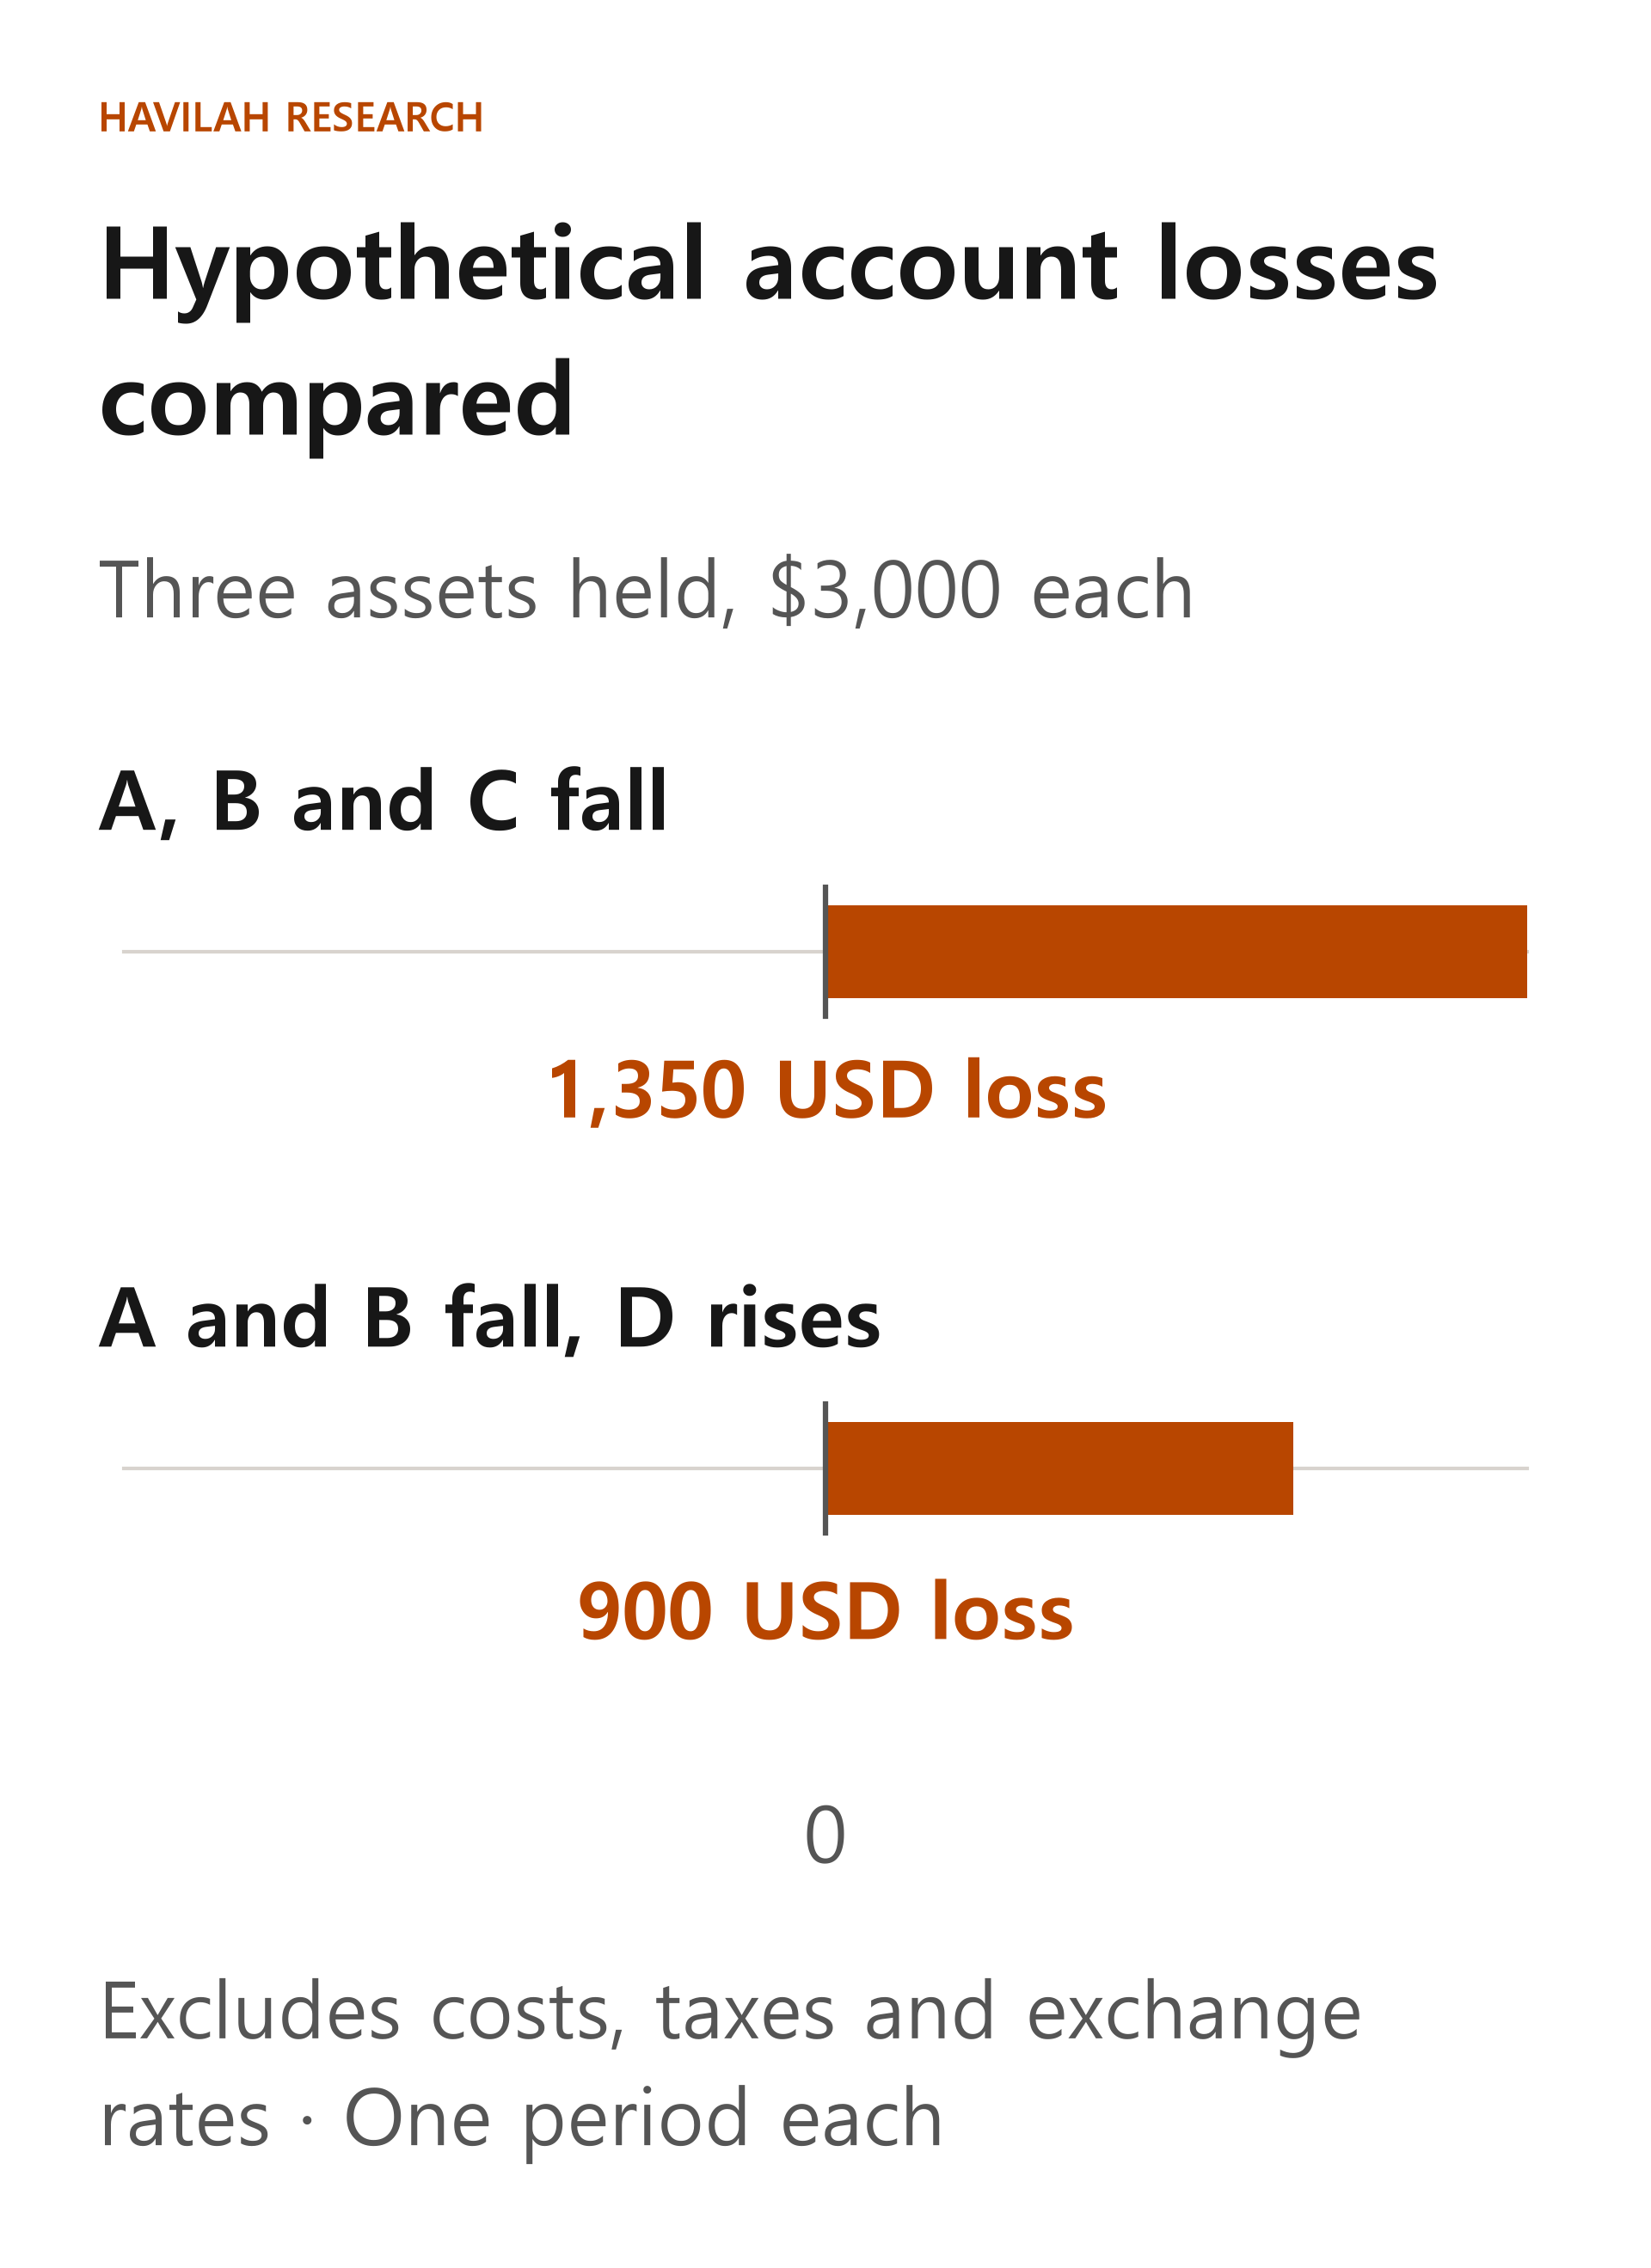
Now change the scenario. Over the same period, A and B fall as before, but another asset, D, which you hold instead of C, rises 5%. D's $3,000 grows by $150. Subtract D's $150 gain from the $1,050 lost on A and B, and the total loss is $900, or 10% of the starting amount.
This calculation only shows how assets that move differently can offset part of a loss. It does not mean D is an asset that will always rise in a real falling market. In other situations, D could fall too, or fall even further.
How to check how closely assets move together
Correlation is a way of looking at how closely the returns of two assets have moved together. It is usually expressed as a number called the correlation coefficient, which ranges from -1 to +1. The closer it is to +1, the stronger the tendency for both assets to have higher-than-usual or lower-than-usual returns at the same time. The closer it is to -1, the stronger the tendency for one to be lower than usual when the other is higher than usual. A value near 0 means this kind of straight-line relationship is weak.
This does not mean the two assets must rise and fall together, or move in opposite directions, every time. Even with a correlation coefficient of 0, they may still affect each other in some other way, and the fact that two assets moved together does not tell you which one is the cause. Nor can you judge the correlation coefficient of two assets from the single-period example above.
To calculate it, you need to pair up returns for the same dates over many periods. For example, you can line up weekly returns for the same span of time, measured in the same currency, and calculate from those. Compare the return in each period, not the price levels, and treat dividends the same way for both assets, either including them or leaving them out. If you invest abroad, the result measured in your home currency can differ from the result measured in U.S. dollars because of exchange rates.
The time span you use also matters. A short recent period and a span covering several years can give different results, and assets that moved separately in the past may fall together in the next crisis. The correlation coefficient tells you neither the size of a loss nor the largest loss you could face in the future.
What should you check in your own account?
First, look at how much exposure each stock and ETF gives you to which industries and countries. Then check whether the companies are sensitive to the same customers' orders, the same commodity prices or the same changes in interest rates. Companies with different names can still depend on similar conditions to make money.
Next, imagine one bad scenario. For example, if demand in a particular industry fell, write down which of your holdings it would affect and how, then multiply each holding's weight by a hypothetical loss rate to calculate the effect on your whole account. These numbers are not a forecast but assumptions that help you think about whether you could bear the loss.
If needed, you can adjust your weights or look at other assets. But diversification does not make losses disappear, and changing your weights can involve trading costs and taxes. When you decide whether to sell, weigh taxes, your investment horizon and your need for cash together.
Look at the loss plan for each individual stock together with the chance that holdings across your whole account fall at the same time. In the next lesson, we will look at how stop-loss orders work when a price falls sharply overnight.