
Say you have a trading method that worked well while prices were rising: you buy when the price rises above its previous peak and keep holding while the rise continues. But what happens if the price just moves up and down within a certain range?
Even with the same rules, the results can differ depending on how the price moves. First, let's look at what rising, sideways and falling mean on a chart.
How do you tell rising, sideways and falling apart?
If the peaks and troughs get gradually higher as the price moves up and down, this is called an uptrend. If the peaks and troughs get gradually lower, it is a downtrend. When the price moves up and down within a similar range with no clear direction, it is said to be moving sideways.
Which of these you see depends on the period you look at. A stock may have risen for a few weeks, yet on a longer-term chart that rise may be just part of a downtrend. A trend only describes how the price has moved so far; it is not a promise that the movement will continue.
When a rule that follows rising prices starts to falter
Suppose a hypothetical price records $100, $104, $99, $104, $99 and $103, in that order. The figure below shows a price path made up for illustration; it is not an actual market result.
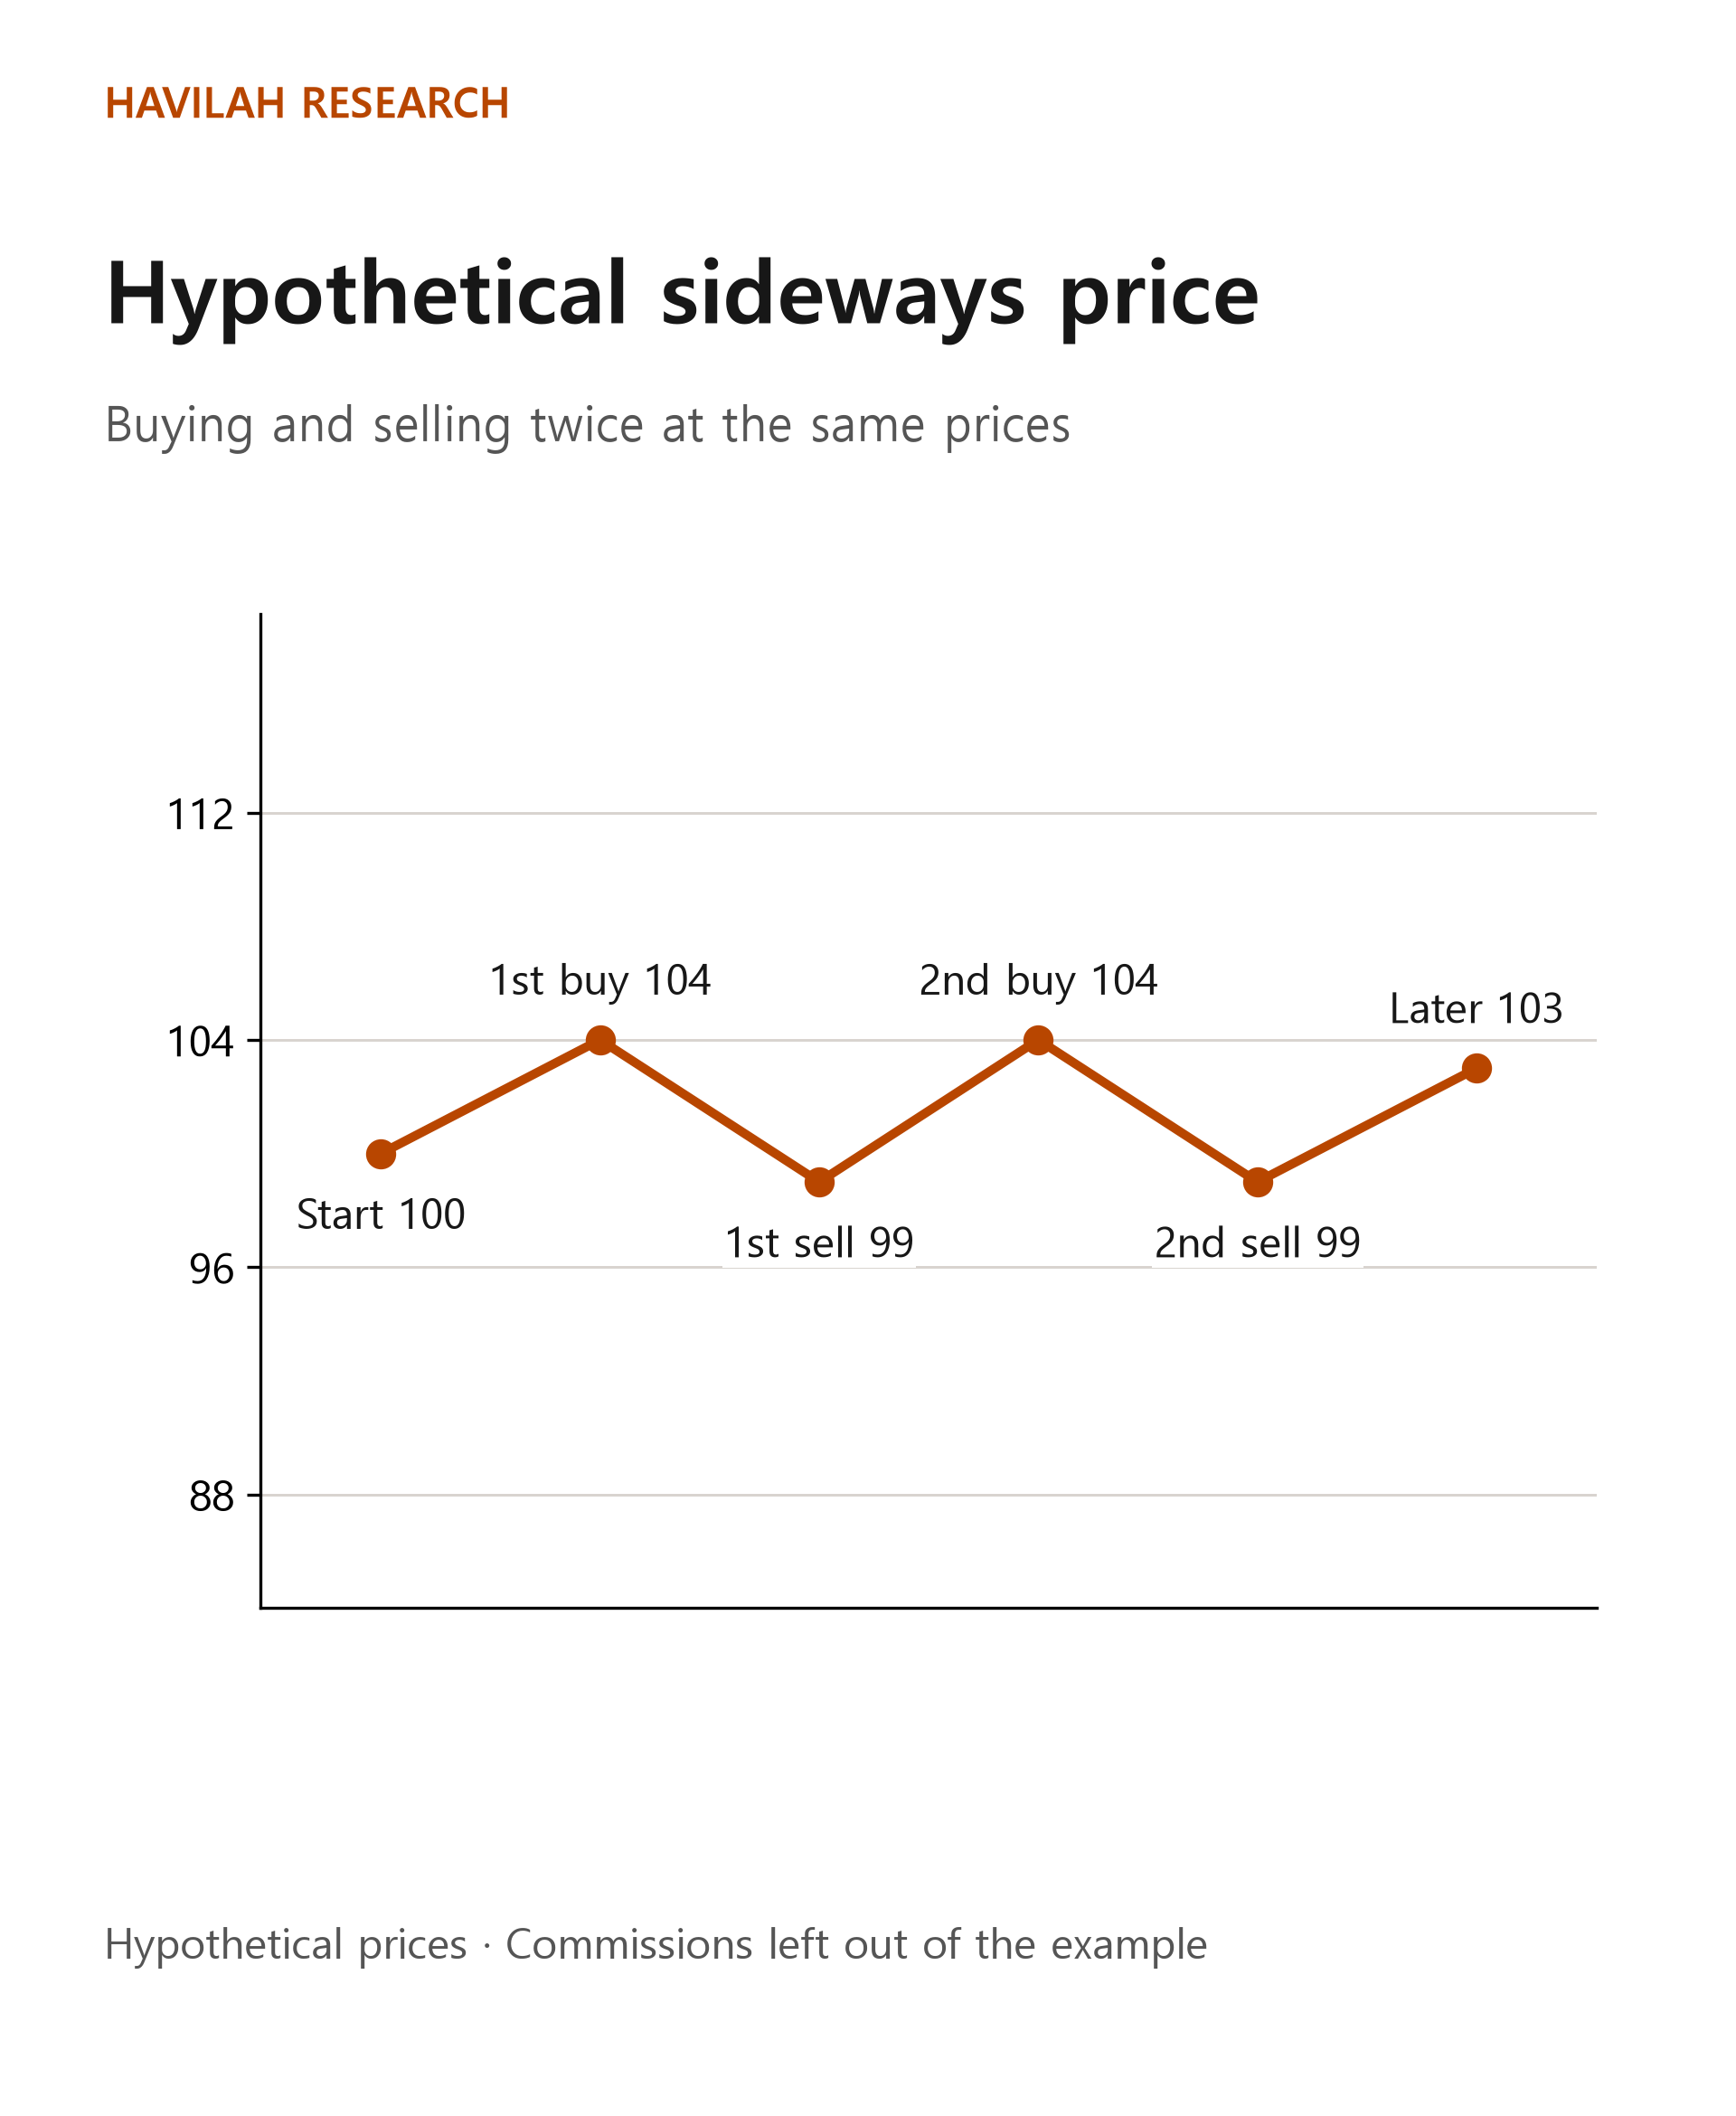
Suppose an investor uses a simple rule: buy one share when the price reaches $104, and sell it when the price reaches $99. In the sequence above, a trade of buying one share at $104 and selling it at $99 happens twice. The second trade starts after the first one is finished.
Each loss is 104 − 99 = $5. Adding the two losses gives 5 + 5 = $10. This assumes that both purchases and both sales are filled at the assumed prices and that there are no commissions, taxes or currency conversion costs. If there are costs, the actual loss will be different.
This example does not show the actual performance or the probability of success of any particular strategy. It only shows that when the price rises and falls again and again, a rule that tries to follow rising prices can produce several losses. The price can still rise after moving sideways, and it can drop suddenly even in a rising market.
What changes in a falling market?
Even a falling stock bounces along the way. That is why it is hard to conclude that a decline is over just because the price rose for a short while. You can decide which period you care about and watch how the peaks and troughs, the company's results and any important news change over that period.
Trying to buy near the bottom carries its own risk. Even if a stock looks cheap enough, it can fall further, and if the company's situation gets worse, the price may not return to its earlier levels. Waiting, or adjusting how much you invest, are also possible choices.
Why do moving averages react late?
A moving average is the average of past prices over a set period. In a simple moving average, for example, even after a new price is added, the earlier prices stay in the average for the rest of that period, so the line may not keep up right away when the direction changes.
When the price moves up and down around the average line, a rule of buying when the price crosses above the line and selling when it falls below can be triggered several times. On the other hand, when the price moves in one direction for a long time, the moving average may help you keep track of that direction. Either way, a moving average does not guarantee where the price will go next.
Applying this to real investing
First decide which period you look at and what your rules are, then check the range in which the stock moved over that period. Even if you think the price is moving sideways, it can suddenly break out of the range, and a rebound can begin after you have decided the stock is in a decline.
When you test a rule on past prices, include not only rising periods but also sideways and falling stretches, and calculate commissions and fill conditions on the same basis throughout. There is no guarantee that past results will repeat. Along with the chart, also check the individual company's business and financial condition, and how much money you can afford to invest.
In the next lesson, we will look at how to tell a simple, temporary price move from a situation in which the reason behind your investment decision has turned out to be wrong.