
A stock you are watching has just risen above $100, a level it failed to get past several times before. Should you buy now, or wait for it to come back down?
These two choices are different trading plans. Neither one is always better than the other. First, let's look at what each one is waiting for and what happens when the wait does not work out.
Breakout trading: when the price moves above an earlier range
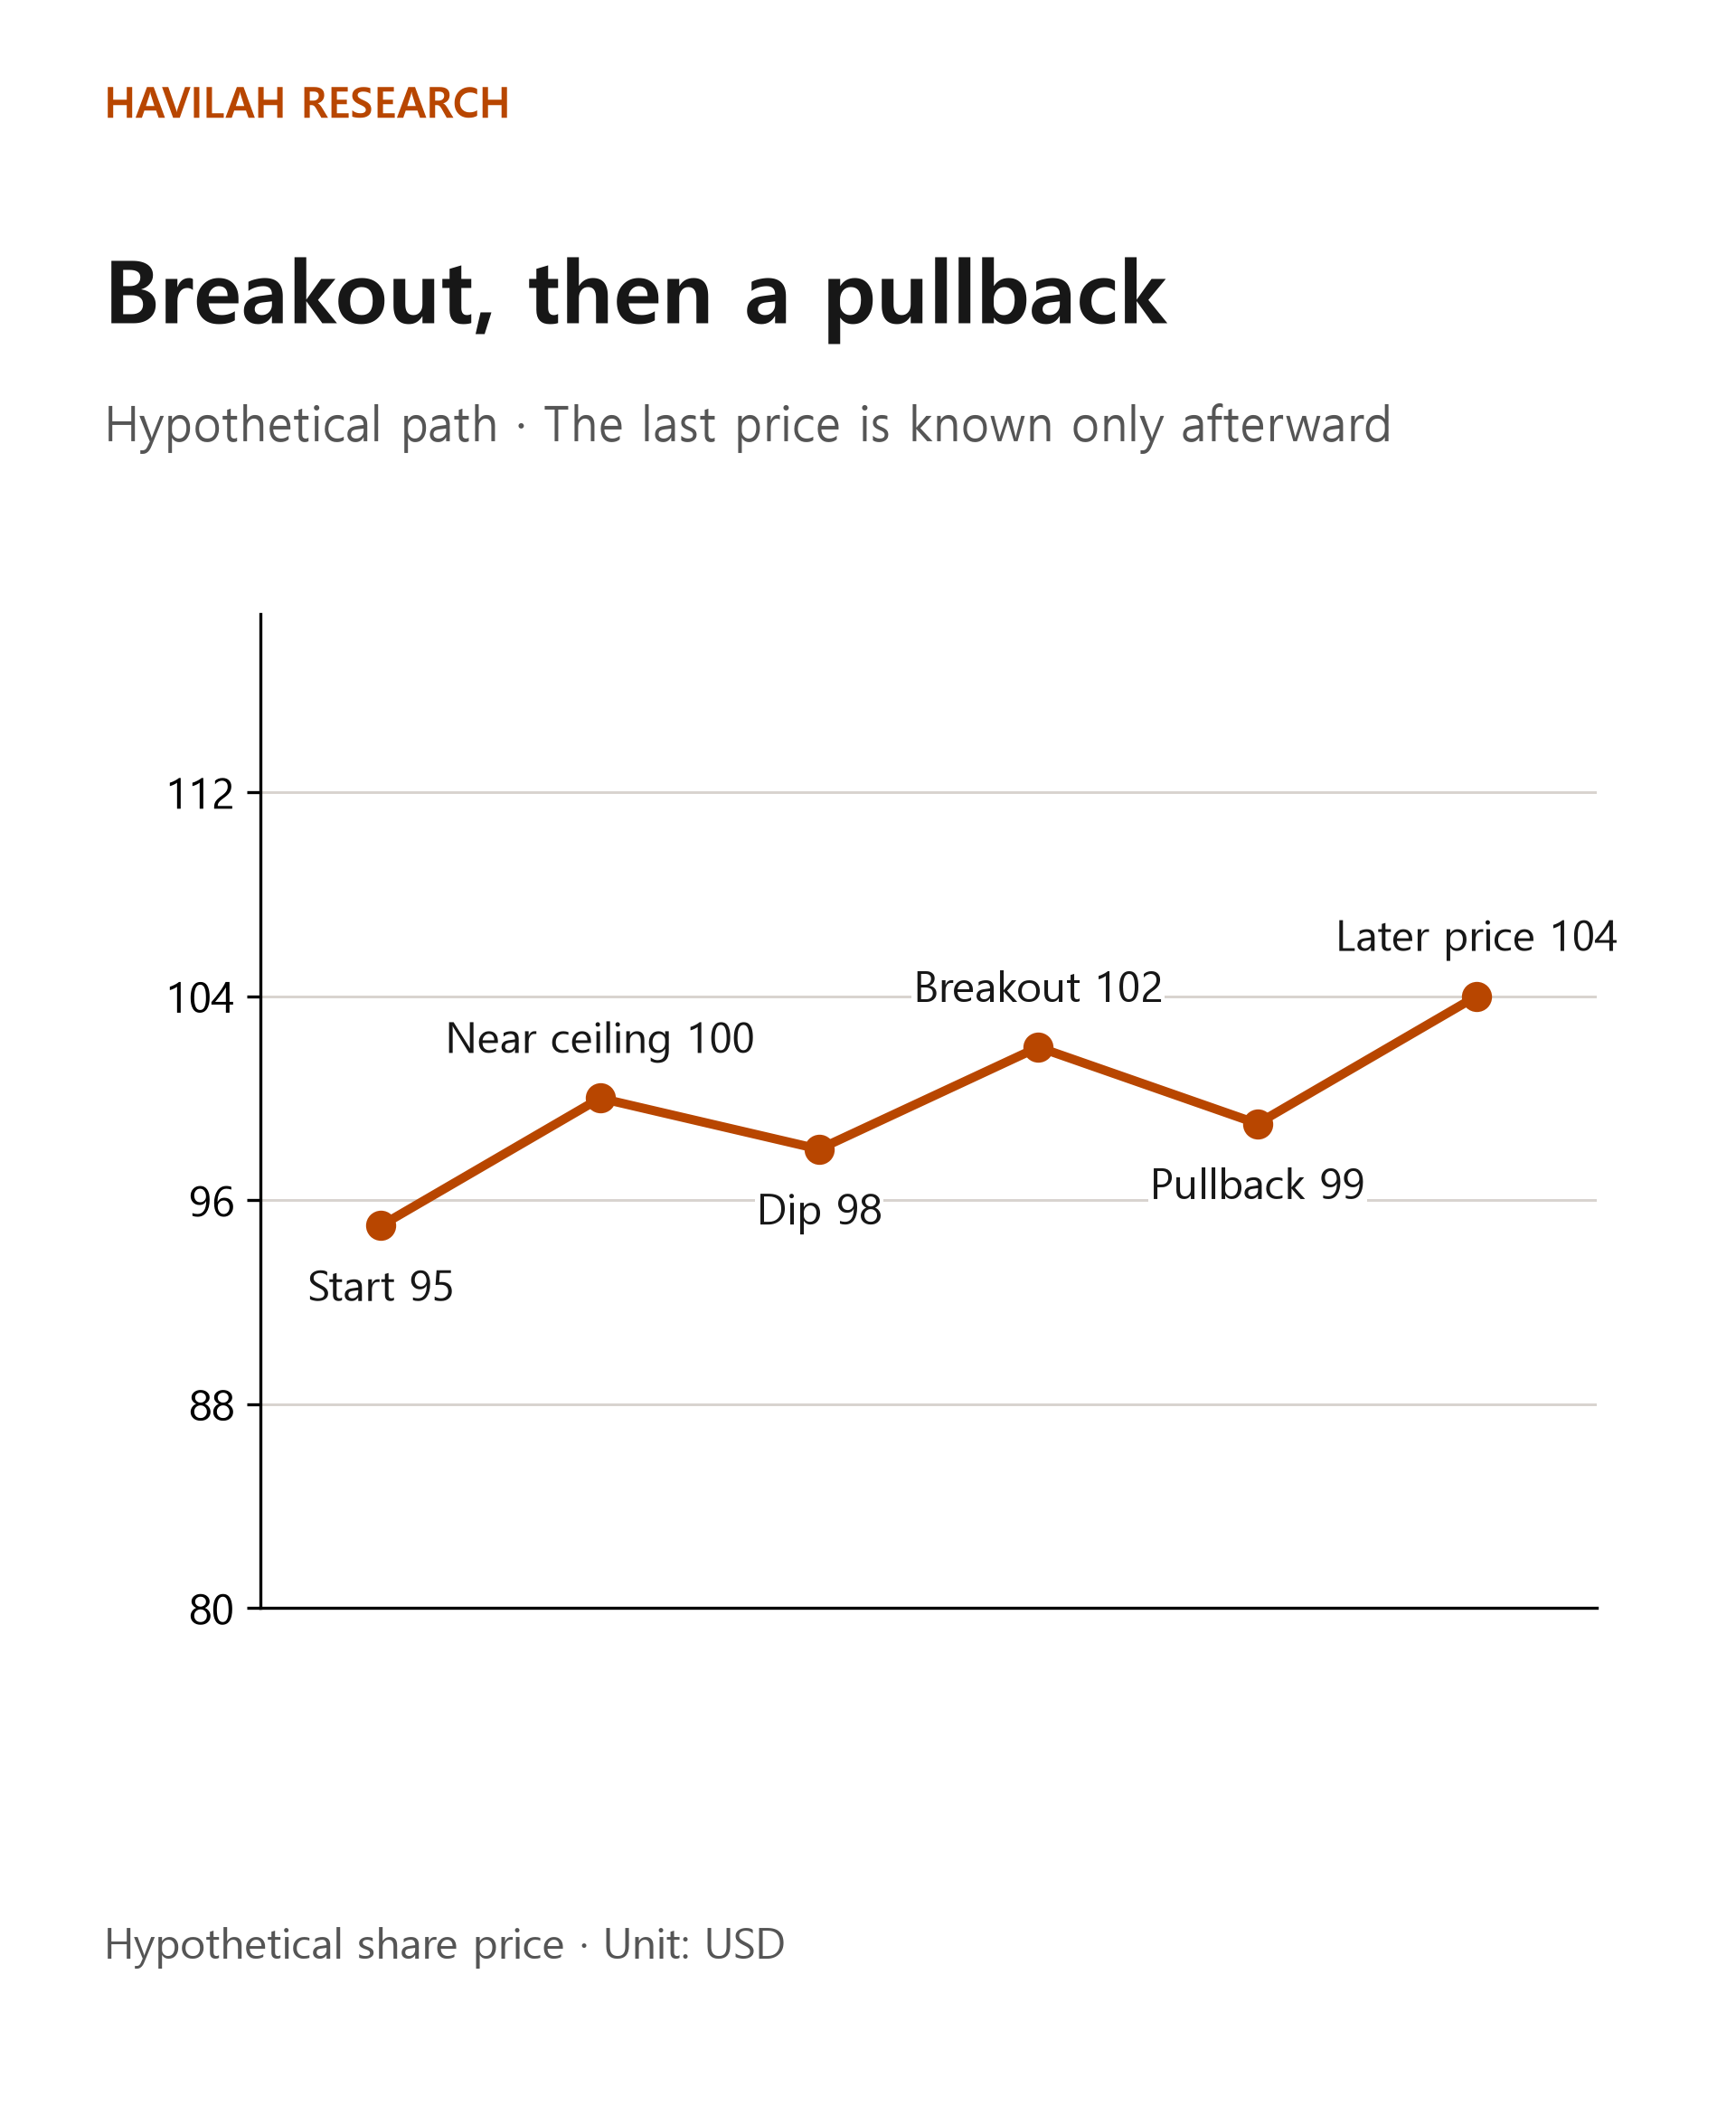
Suppose a stock has failed to rise above about $100 for some time. One day it moves past that level and reaches $102. Planning a purchase after seeing a move like this is one example of breakout trading.
An investor waiting for a breakout watches for the chance that the price keeps rising after it clears a range where it was blocked before. But the price can move above that range briefly and then come back down. When the price returns into the earlier range after a breakout like this, it is called a false breakout.
Pullback trading: when the price comes back after a rise
Now suppose the same stock rises to $102 and then falls back to $99. A temporary retreat after a rise is called a pullback. One approach is to plan a purchase while watching for the decline to stop and the price to start rising again.
However, at that moment you cannot know for sure whether $99 is the end of a temporary pullback. The price may go on to fall further. On the other hand, the price may never come back down while you wait and simply keep rising, so you miss the chance to buy.
The figure below is a hypothetical example to help you picture the price movement described above. The last price, $104, shows what happened afterward, so treat it as unknown at the point when you were deciding whether to buy.
Comparing the two with the same stop-loss level
This time, consider a separate hypothetical situation in which, after the moves in the figure above, the price falls to $94 instead of continuing to rise. Assume that one person who bought at $102 and another who bought at $99 both sell one share at $94.
If you bought at $102, the loss per share is 102 − 94 = $8. If you bought at $99, it is 99 − 94 = $5. Both calculations leave out commissions, taxes and exchange-rate changes, and assume the orders were filled at exactly those prices.
Buying lower means a smaller planned loss, but while you wait for the price to reach $99, your order may not be filled. And this one case cannot tell you how often each way of entering succeeds, or which one earns higher returns.
Order price versus actual fill price
When a share price moves quickly, the price you saw on screen and the price at which your order is actually filled can differ. For example, a stop order, which turns into a market order when the price reaches a set level, is not guaranteed to be filled exactly at that trigger price.
A stop-limit order, once its condition is met, can be filled only at the price you set or a better one, but if the price moves away quickly, it may not be filled at all. The order types you can use and the hours they apply differ from broker to broker, so check them before you actually place an order.
Decide first under what conditions you will buy
If you are watching for a breakout, you can decide in advance which price range it has to clear, and how you will tell a brief move above it from one that holds until the close. If you are watching for a pullback, you can decide how far down you are willing to wait and what further decline would change your judgment. These conditions are only examples, not the right answers.
Whichever method you use, also take into account how much you will invest, fills that differ from what you expected, trading costs, and important dates such as the company's earnings releases. The shape of a price chart alone does not determine a company's value or its future returns.
After a trade, write down whether you acted on the conditions you set and what the result was; this record will help with your next decision. In the next lesson, we will look at how the same strategy can work differently not only in rising markets but also in sideways and falling markets.