
Three buy signals have appeared on a chart. Are they more reliable than a single signal?
They might be, but before you count the signals, there is something to check first: whether the three indicators look at different information, or whether they calculate the same price movement in different ways.
You may be looking at the same prices several times
A technical indicator is a calculation based on data such as price or volume, displayed on a chart. A moving average, for example, is a tool that averages prices over a set period so you can follow the price trend.
Assume a hypothetical stock closed at $10, $11, $12, $13 and $14 over five trading days. The average of the latest 3 days is (12 + 13 + 14) ÷ 3 = $13. The 5-day average is (10 + 11 + 12 + 13 + 14) ÷ 5 = $12.
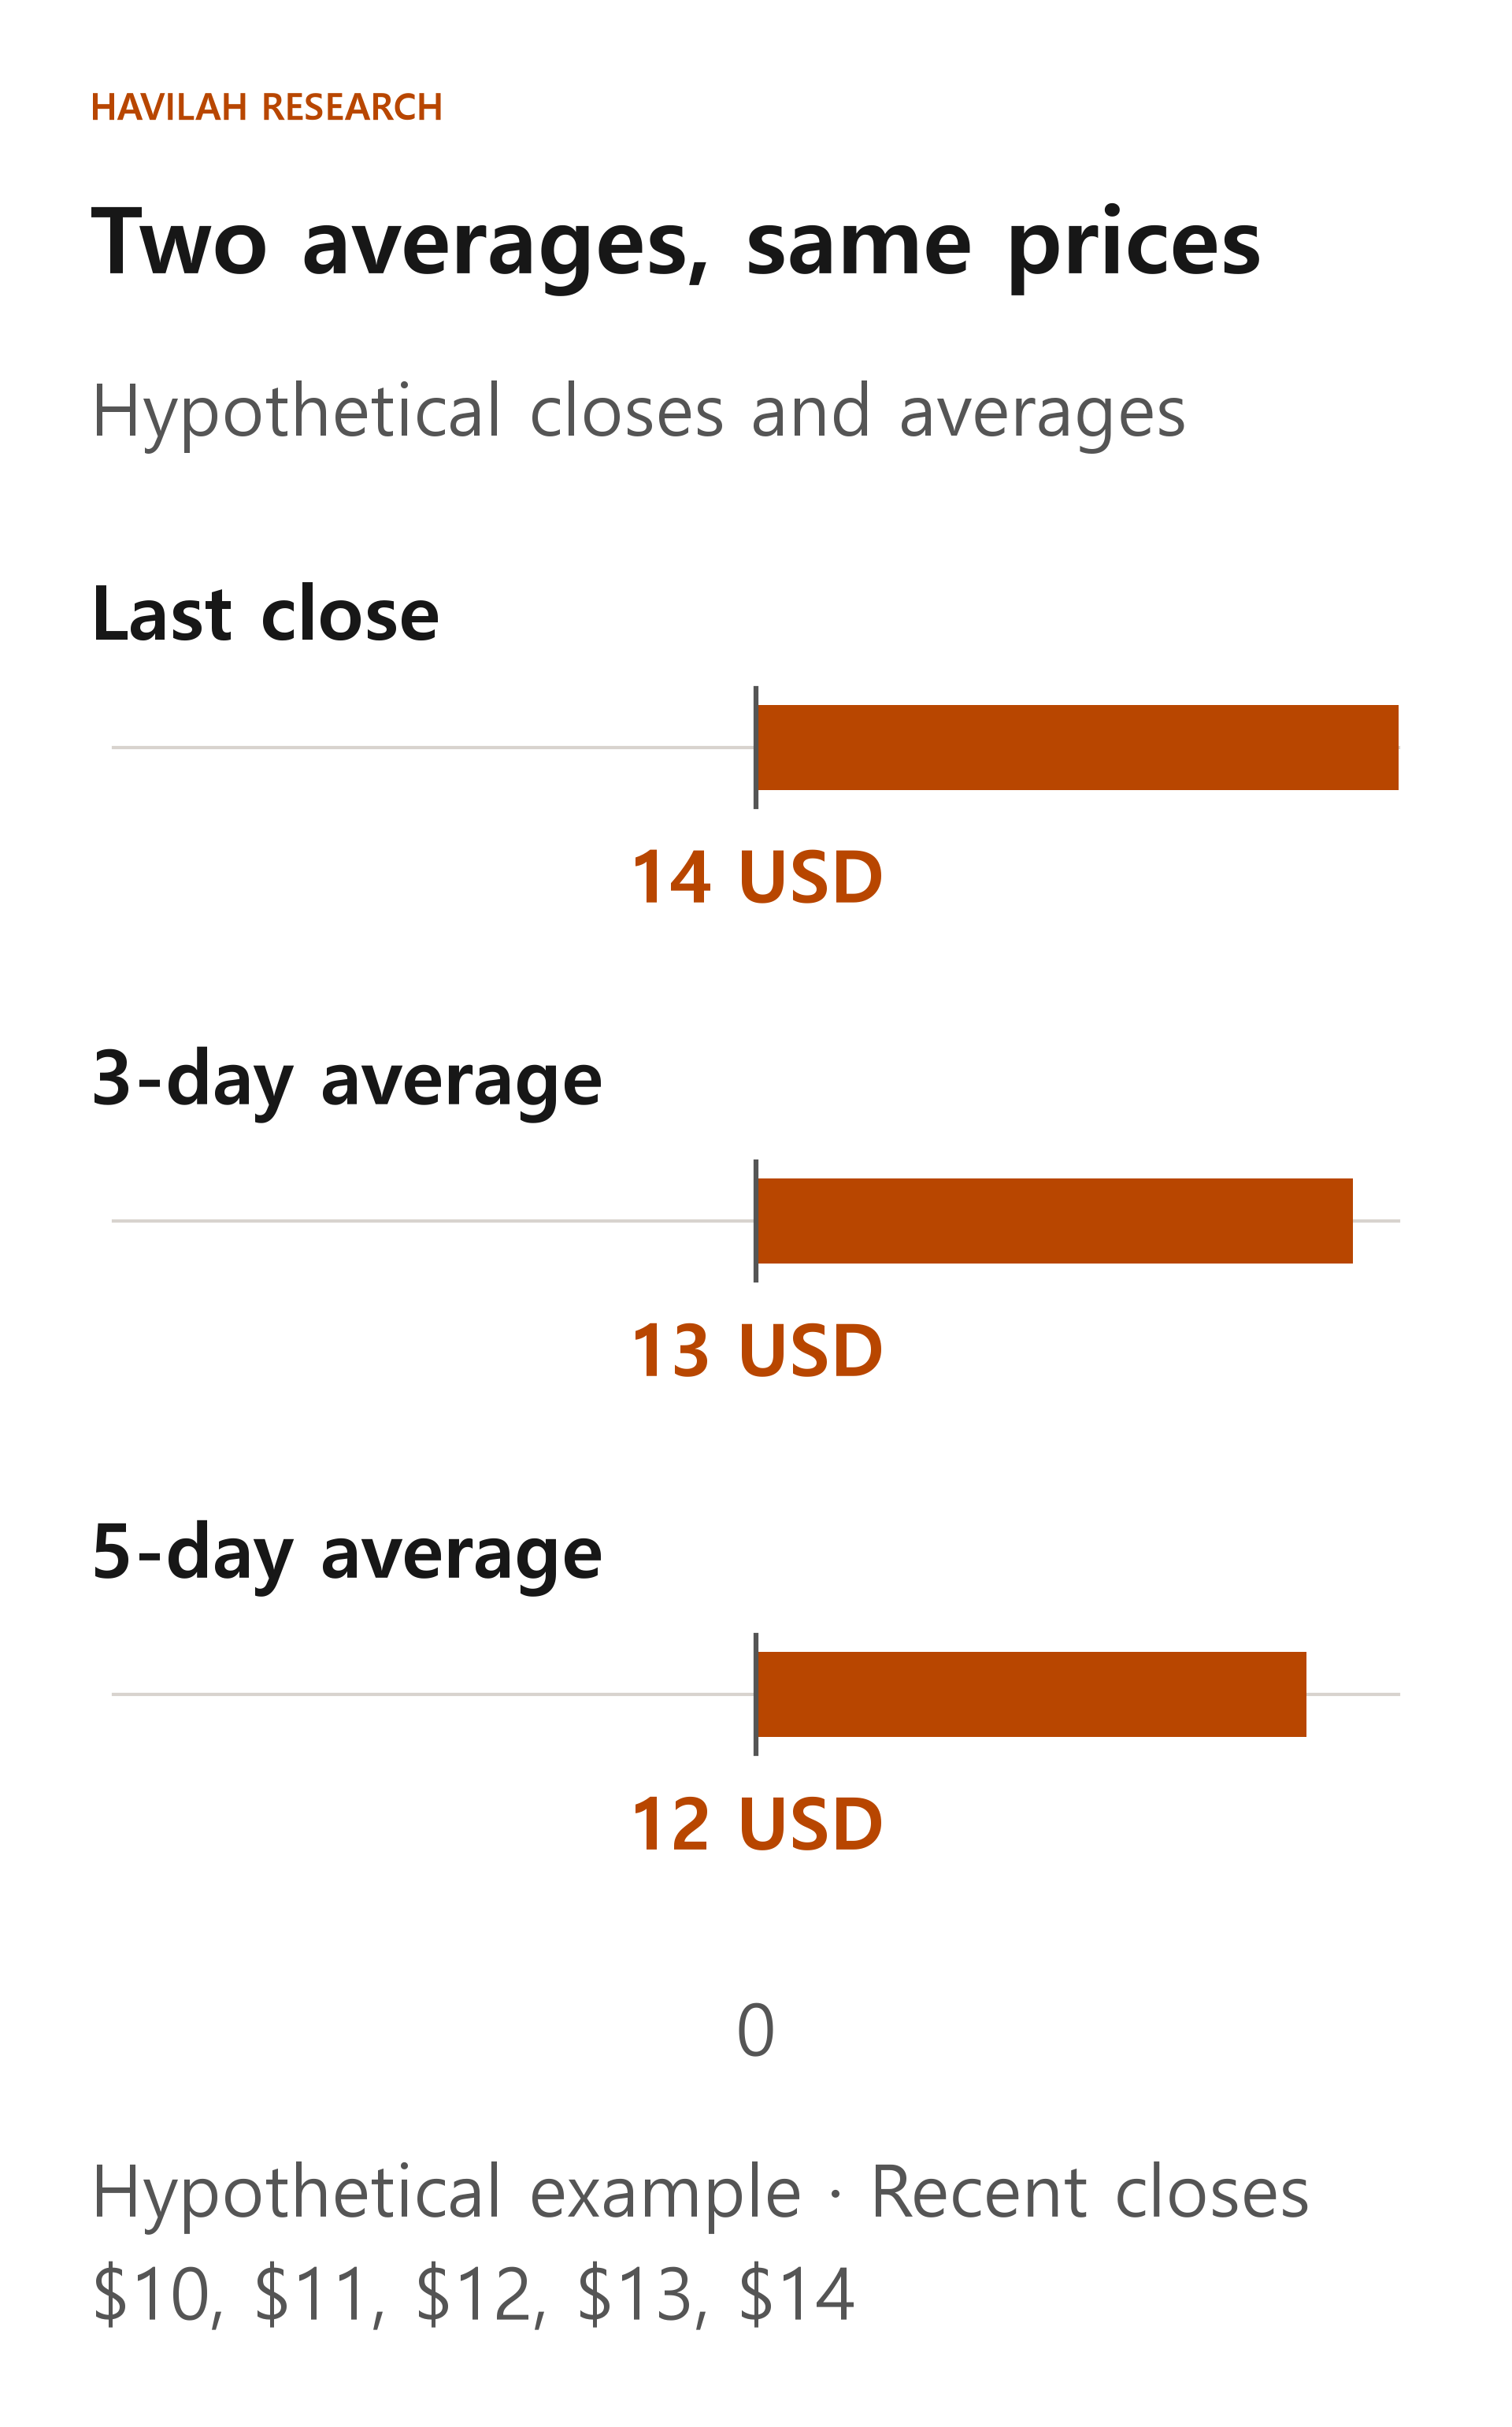
The last close of $14 is above both averages. Both lines give a clue that points the same way, but both averages are built from the same price record. The prices of the last 3 days go into both the 3-day and the 5-day average. So it is hard to count the two signals as two fully independent pieces of evidence.
Ask what each indicator looks at
When you choose indicators, look at what each one does rather than at its name. A moving average shows the average of past prices, ATR shows the size of recent price moves, and volume shows the number of shares traded. They are tools that answer different questions.
That does not mean that adding a different kind of indicator always improves your predictions. For example, price and volume can both react to the same market situation. Set out what you will do when each condition is met, and check whether that combination actually helps.
Indicators use prices and volume that have already happened, so a signal may appear only after an important change has already taken place. Or a signal may appear and the price may soon move the other way.
Will a rule fitted to the past work in the future?
Suppose an investor keeps changing the moving-average periods and indicator thresholds on charts covering the same period. Among the many combinations, some may show good results for that period purely by chance. Choosing rules to match results after you have already seen the past "answers" is called fitting past data too closely, or overfitting.
To reduce this problem, you can separate the period you use to set the rules from a later period you use to check them. For example, you choose the rules using the earlier part of the data, then apply the same rules to the later part, which you did not use when making your choice. If you keep adjusting the rules after looking at the checking period, that period is no longer completely fresh data for checking.
A backtest like this, a test on past data, is a calculation based on assumptions, not actual trading. Even if the rules also looked good in the later checking period, that does not guarantee future performance, because market conditions and the range of data can change.
Look at results after trading costs
In a hypothetical trade, if $10,000 grew by 2% before costs, the profit is $200. If the costs of buying and selling add up to $100, the remaining profit is $100, or 1% of the starting amount. This is a simple calculation for illustration, and it leaves out taxes and changes in exchange rates.
In practice, besides order commissions, the gap between the price you wanted and the actual fill price, currency conversion costs and other items can affect the result. As the number of trades grows, the costs can change too, so include them on the same basis when you compare rules.
Questions to ask before you add an indicator
Next to each indicator, write one sentence on what you use it to check. If an indicator only shows the same price changes over again, it is better not to let your confidence grow just because there are several of them.
Also check whether the data was actually available at the time the signal appeared, whether trading costs were included, and whether you tested other periods as well. Technical indicators do not replace an understanding of a company's business and finances. Settle your reasons for investing and the risk you can bear first, then use indicators as tools that support your judgment.
In the next lesson, we will look at how to think about the price at which to buy, even when you believe a company is a good one.