
As the share price got close to $100, trading picked up. At this price, some people bought and some people sold. Does that mean $100 is a price where the share price will keep stopping in the future?
A price at which a lot of trading took place is a level investors may well pay attention to. But heavy trading there in the past does not by itself mean the same thing will happen again.
Looking at volume by price instead of by time
An ordinary volume bar shows how many shares traded over a set time, such as a day or a week. A volume profile instead shows, for a period you choose, the price levels at which the most shares traded.
For example, assume that during one day, 200 shares traded at $99 or more but less than $100, 500 shares at $100 or more but less than $101, and 300 shares at $101 or more but less than $102. These are illustrative numbers, not real market data. So that the boundary prices do not overlap, each range includes its lower price and excludes its upper price.
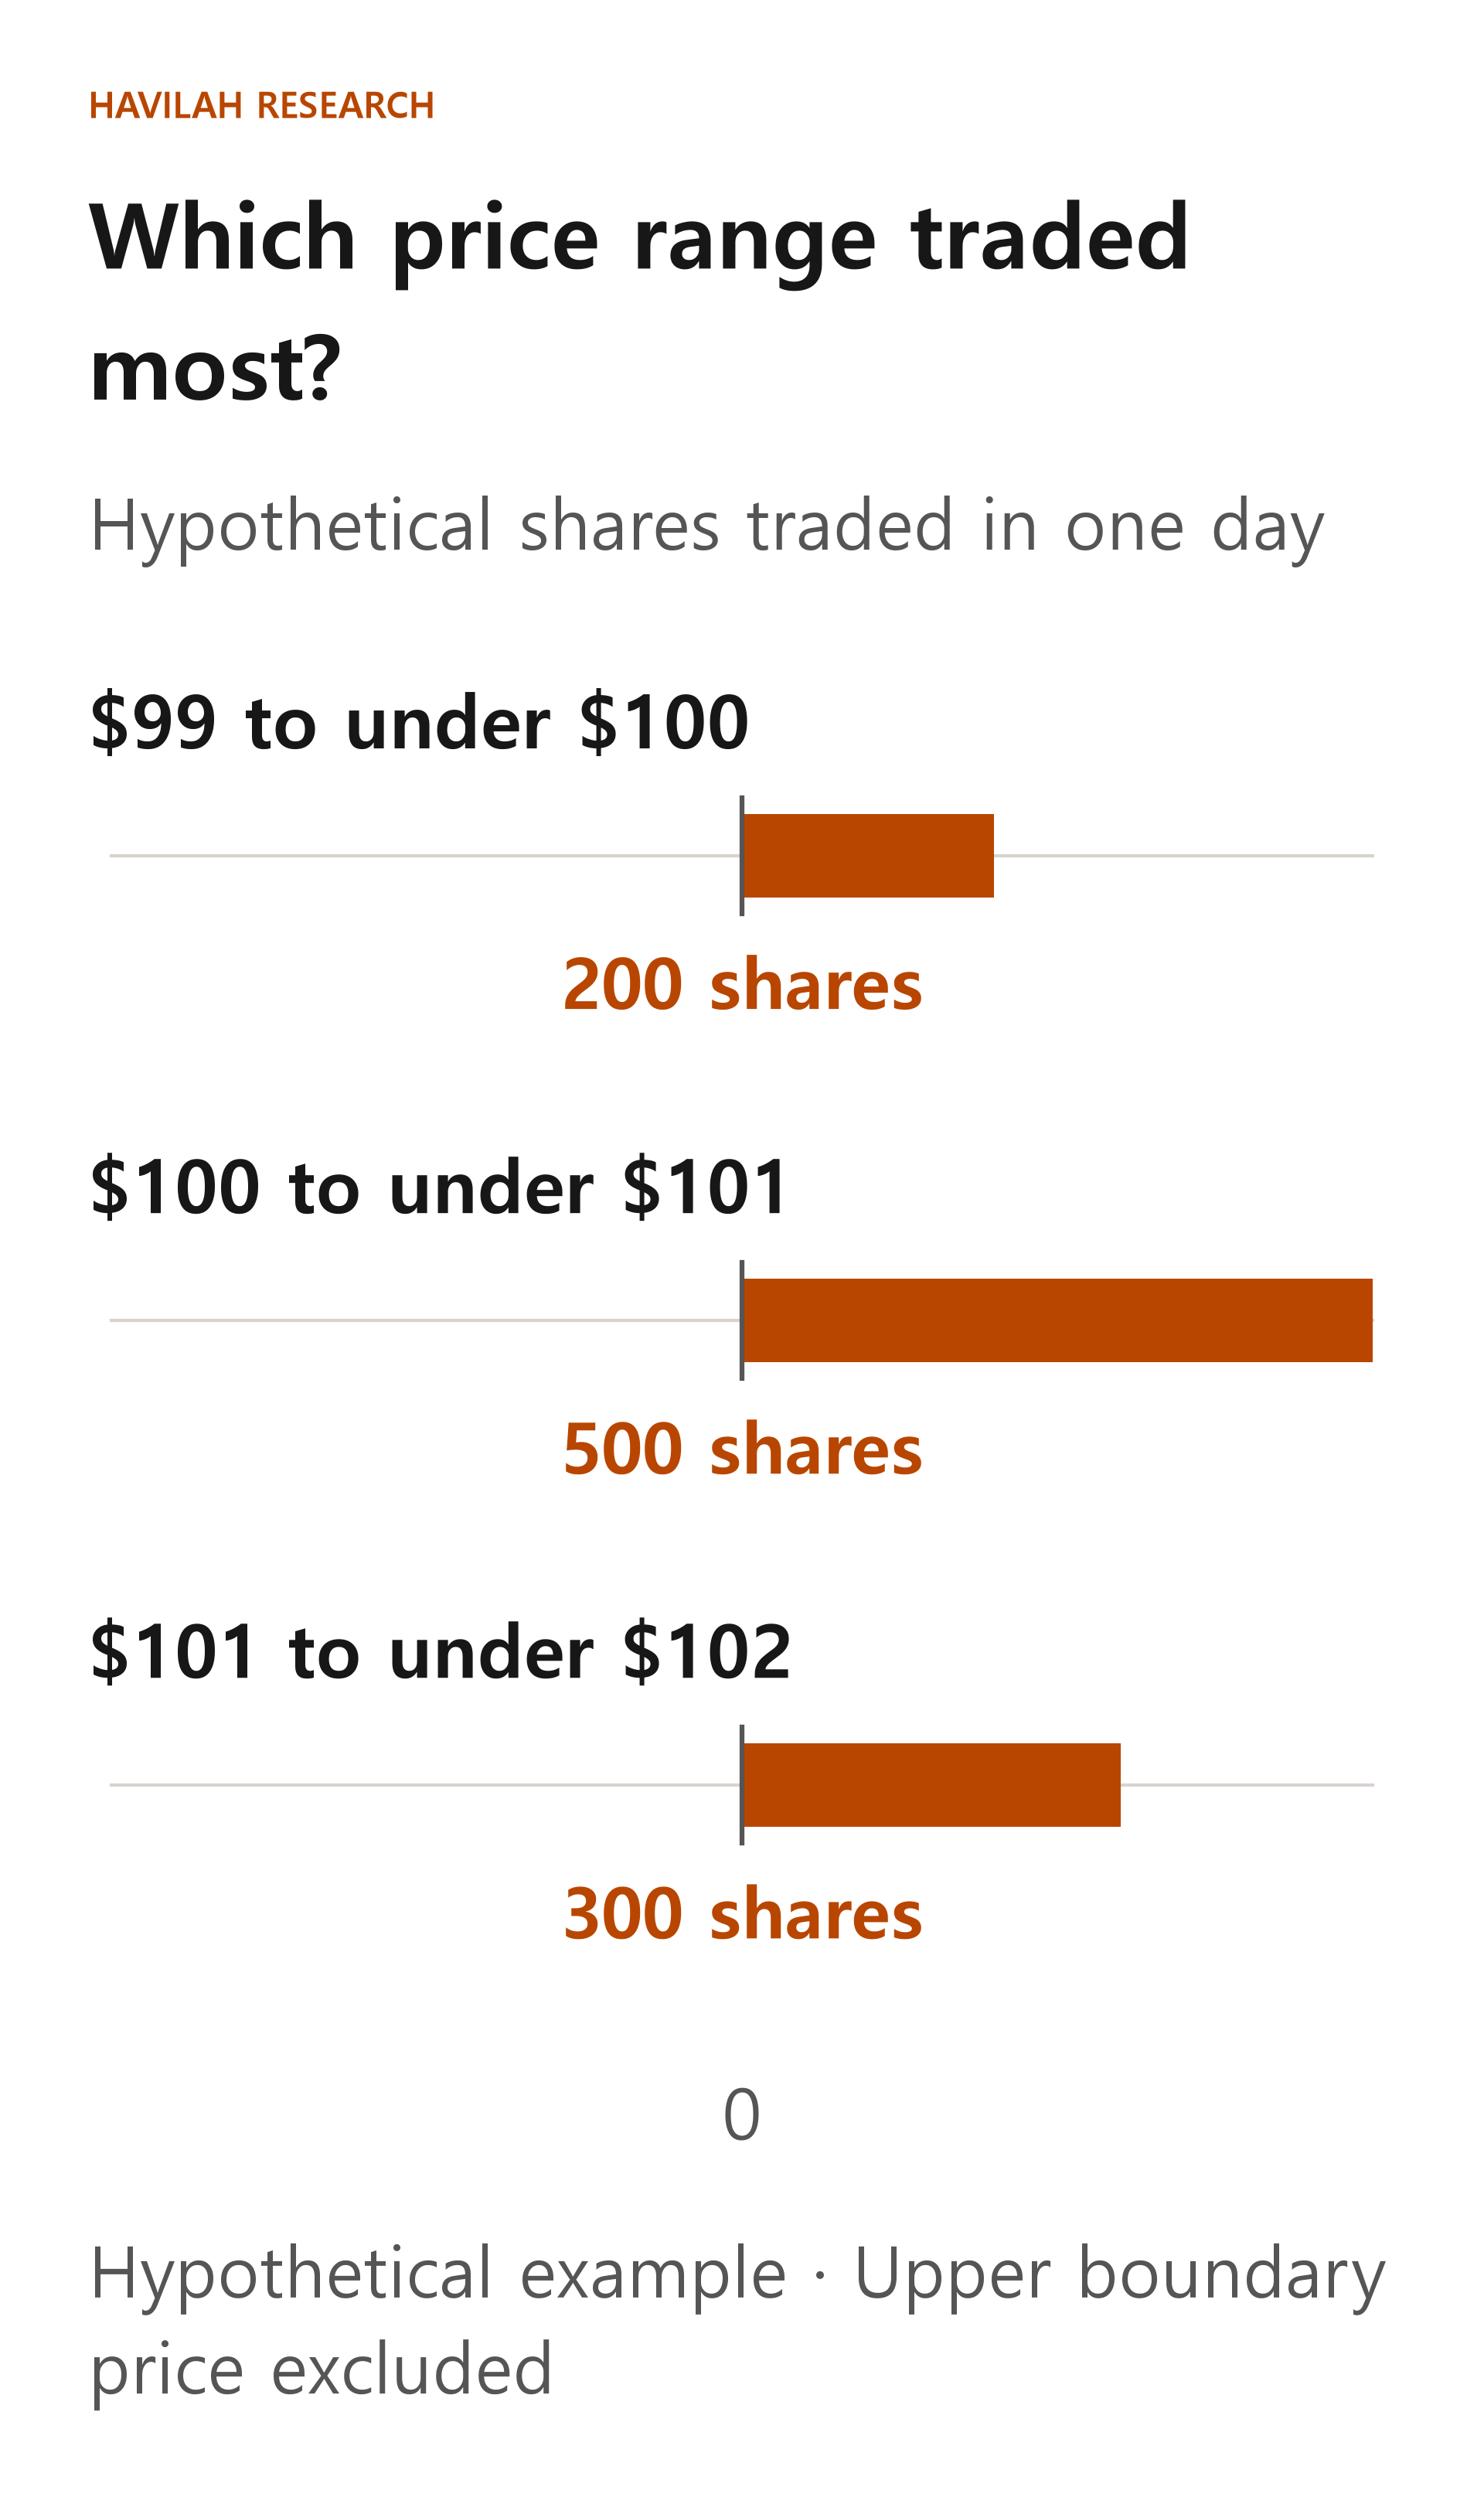
The volume in the three ranges adds up to 200 + 500 + 300 = 1,000 shares. The range with the most trading is $100 or more but less than $101, where 500 shares traded. Its share of the total is 500 ÷ 1,000 × 100 = 50%.
Charting tools sometimes call the price or price range with the most volume over the chosen period the POC (point of control). The $100 to $101 range above is the POC in this hypothetical example.
Change the period, and the result changes
The price range with the most trading can differ depending on whether you look at a single day or a whole month. The result also changes depending on whether you split the price ranges into $1 steps or wider ones.
Each service may also group the actual trade data in its own way. For example, some tools use prices and volume from shorter time intervals, while others assign a bar's entire volume to the price range that contains that bar's closing price. So rather than assuming that the numbers shown are the exact fill prices of every trade, read the tool's own explanation.
If there was a lot of trading, who won?
Every trade has both a buyer and a seller. The fact that 500 shares traded does not tell you whether buyers will keep paying higher prices or whether more sellers are still waiting. Nor can you tell from this number alone whether the people who already traded still hold the shares.
Be careful with chart colors, too. Some services compare the open and close of short time intervals and show the volume from rising intervals and from falling intervals in different colors. Do not take these colors as telling you exactly what real buyers and sellers intended or how many orders are still waiting. Check how each service calculates its colors.
For example, even if a lot of trading took place between $100 and $101, the share price could pass quickly through that range after a new earnings release. A price where volume was high in the past is a candidate to watch, not a wall that is bound to act as support or resistance.
How can you use it in real investing?
When you look at the volume profile of a stock you are interested in, first check the period, the size of the price ranges, and whether only the regular session is included. Then you can compare the prices where a lot of trading took place with the current share price, and watch how the price actually reacts when it approaches those ranges.
Do not base your decision on one chart alone. Check whether the company's situation has changed, for example in its results and filings, and if you buy, think about how much money you can afford to invest and what you will do if you turn out to be wrong. Volume shows trades that have already happened, but it does not promise profits.
In the next lesson, we will look at why using several similar technical indicators together does not necessarily make your judgment more accurate, even if it gives you more signals.