
A share price has come down from around $100 several times and then risen again. Will it fail to get past $100 again this time? Or will it break through this time?
Investors who read charts give names to recurring price movements like this one and study them. Triangles, flags and head-and-shoulders are examples. These names describe the shape the price has made so far, not the direction it is bound to take next.
Triangles: when the price range narrows
Suppose a share price fails several times to rise beyond around $100, but each time it comes back down, its low is higher than before: $90, then $94, then $97. The highs are about the same while the lows rise, so the space in which the price moves up and down keeps getting narrower.
This shape is called an ascending triangle, because if you draw lines along the highs and along the rising lows, it looks like a triangle. The figure below uses hypothetical prices to show the idea.
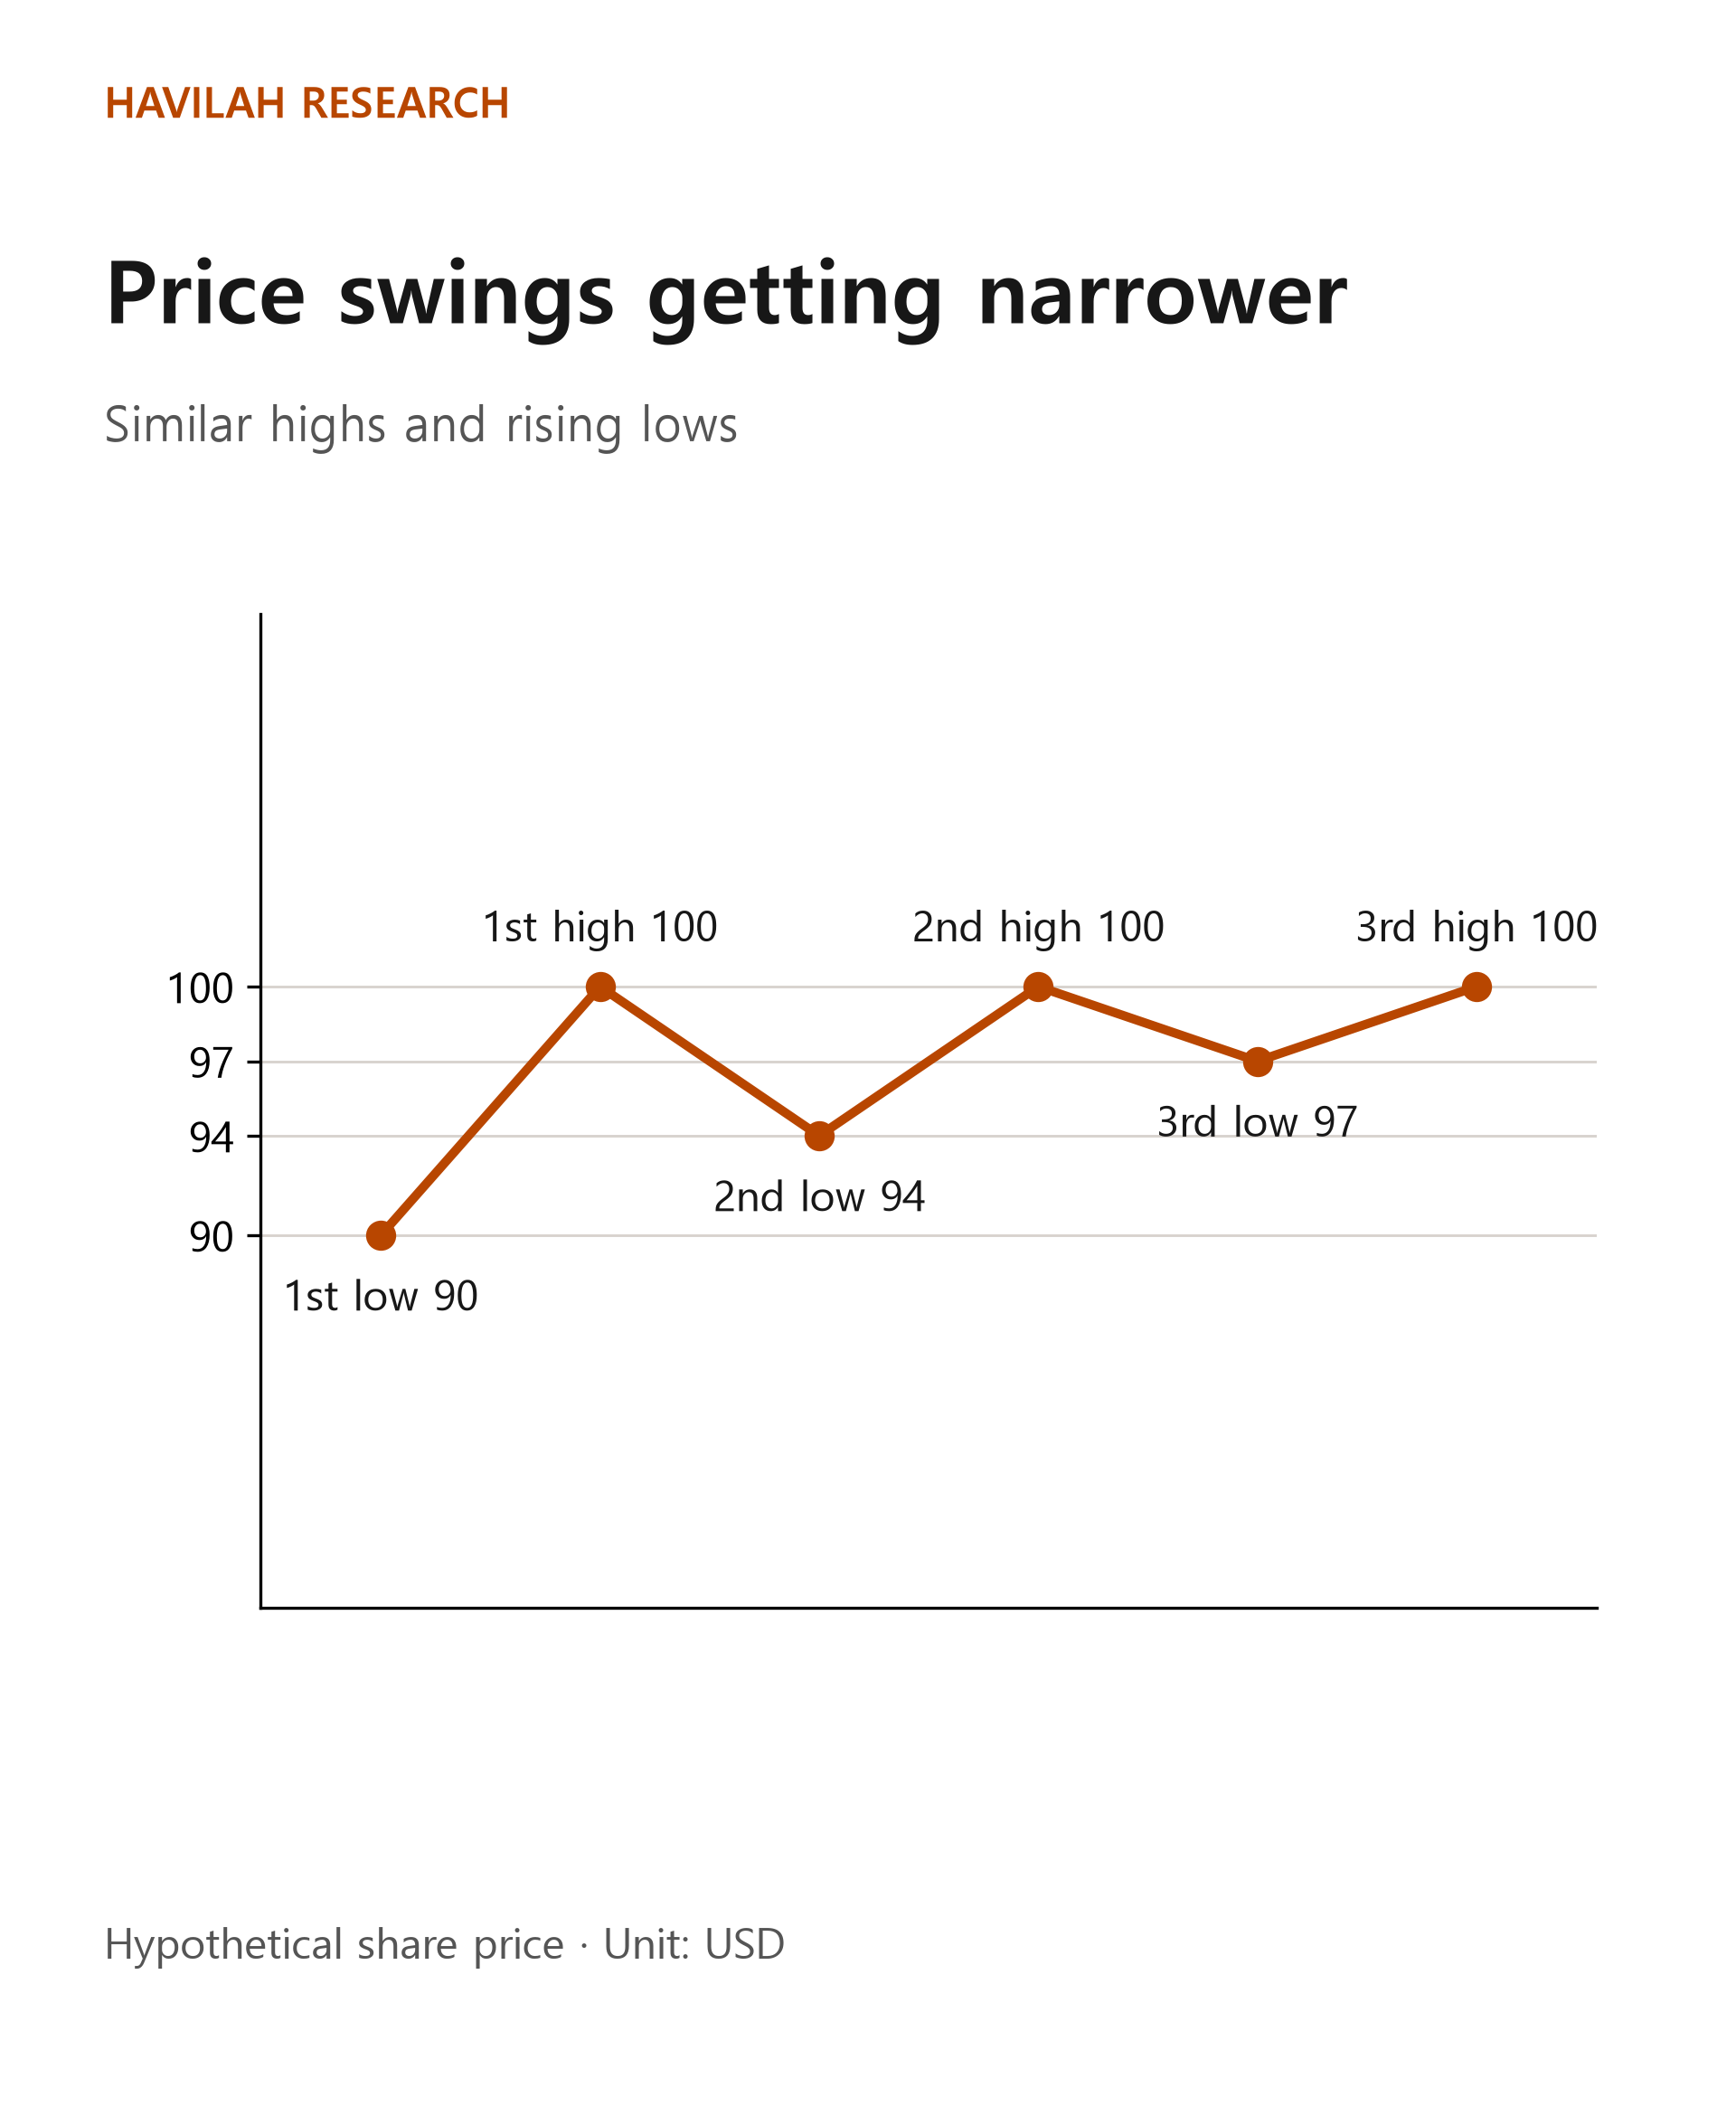
The last $100 in the figure assumes that the price later fell again, which confirmed it as a high. How far the price fell after that is not shown in the figure.
Someone reading the chart might mark the area around $100 as a price to watch. A move by the share price above that level is called a breakout. But the price may rise above it briefly and then come back down, or it may drop lower instead. Where to draw the line, and at what point to count a move as a breakout, also differ from person to person.
Flags: a short pause after a fast move
Sometimes a share price rises quickly over a short period and then drifts slightly lower or sideways within a narrow range. The big rise is likened to a flagpole and the narrow movement after it to a flag. A similar shape can also appear after a fall.
Some investors use a flag as a clue for judging whether the earlier move may continue. But a price that seemed to be taking a short rest can also make a big move in the opposite direction. Seeing the shape does not mean you can be sure the rise or the fall will continue.
Head-and-shoulders: comparing three highs
A head-and-shoulders is a shape in which the middle high is higher than the highs on either side. The name likens the left high, the taller middle high and the right high to two shoulders and a head.
For example, suppose a hypothetical share price rises to $110 and falls back to $100, rises again to $120 and falls back to $100, and then rebounds to $110. If you compare the three highs, the middle one is the highest.
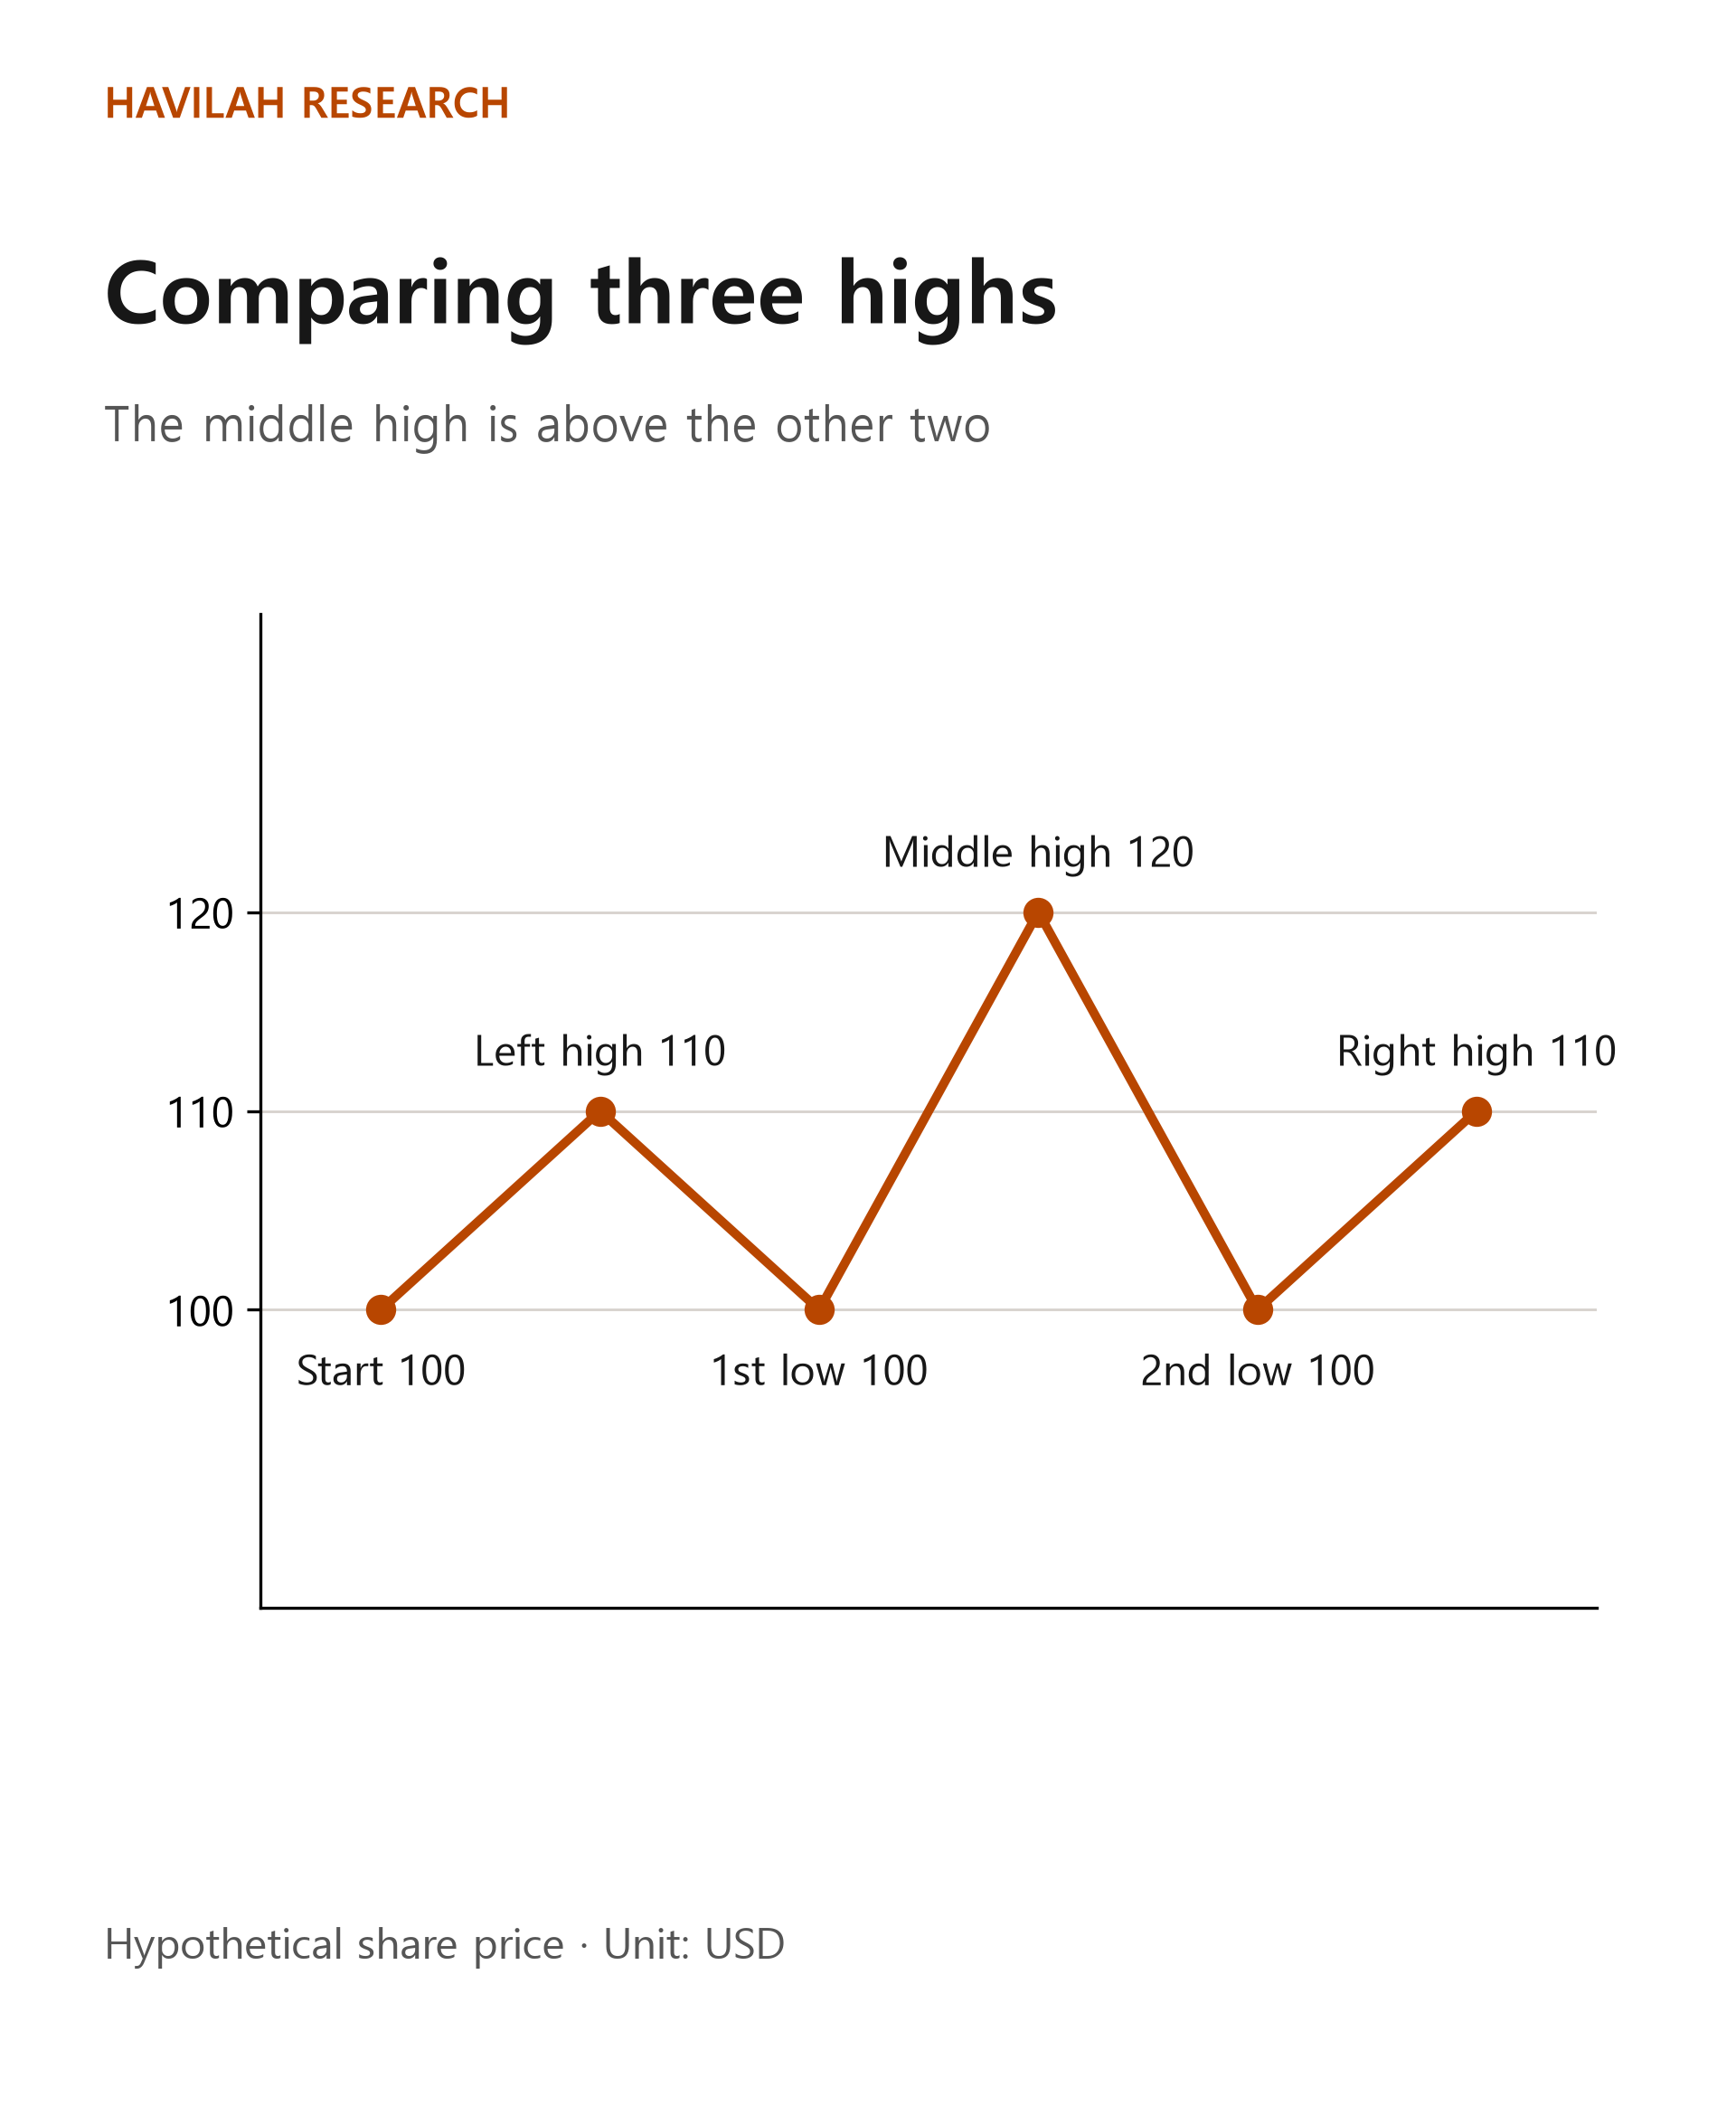
Here too, assume the price fell after the $110 on the right, which confirmed it as a high. The figure does not show the prices after that or whether the price broke below the neckline.
A line connecting the area around the two lows is called the neckline. In this example both lows are $100, so you can picture the neckline around that level. Some people watch whether the share price falls below the neckline after the right high. But where the neckline is drawn and when the pattern is judged complete can vary, and there are failed cases in which the price falls below it and then rises again.
What happens if a breakout fails?
The following is a hypothetical case for illustration. An investor sees the price rise above $100 and buys one share at $102. Assume the price then falls back below $100 and the investor sells at $97.
The difference between the purchase price and the sale price is $5. Excluding commissions, taxes and currency conversion costs, the loss is 5 ÷ 102 × 100, or about 4.90%. In other words, the fact that the price was once above $100 does not by itself mean the rise will continue after you buy.
Even if the price reaches your reference level, there is no guarantee that your order will be filled at that price. Gaps or fast price moves can make the loss bigger. As you learned in the previous lesson, think about your money and your risk together before you trade.
What should you look at on a real chart?
First, check what time frame the chart uses. The same prices can look messy on a daily chart and form a different shape on a weekly chart. Then look at the highs and lows, the existing trend and volume together. Even a rise in volume does not guarantee that a breakout will succeed.
If you write down in advance why you drew a line and what would tell you that you were wrong, it is easier to look back at the result later. Check the company's results and important news as well, not just the shape of the chart. A pattern is not a formula for predicting the future; it is one tool for organizing the situations that could unfold.
In the next lesson, we will look at what volume by price level and indicators of buying and selling pressure can show, and what they cannot.