
Suppose you bought two stocks at $100 each. One usually moves about $1 a day, and the other moves about $5 a day. What happens if you decide to sell either of them as soon as it falls just $2 below your purchase price?
The stock with larger moves may hit that price often, even while it is only going up and down the way it usually does. So when you plan a trade, you need to look not only at the price but also at the size of the stock's usual moves.
ATR is an indicator that shows the average size of price moves over a set period. ATR stands for Average True Range, but rather than worrying about the name, you can think of it as a tool for seeing how much the price has been moving lately. ATR itself does not tell you whether the share price will rise or fall.
How do you measure a day's move?
If you look only at the difference between the day's high and low, you miss something: news can come out after the previous day's close, and the price can then jump or drop sharply the next day. An empty stretch like this between the previous close and the next trading day's prices is called a gap.
ATR takes this gap into account as well. First you find the day's range by choosing the largest of the following three values.
- The difference between the day's high and the day's low
- The difference between the day's high and the previous day's close
- The difference between the day's low and the previous day's close
Each difference is counted as a positive number, whichever price is higher. The day's move found this way, including any gap, is called the true range.
Calculating it with hypothetical numbers
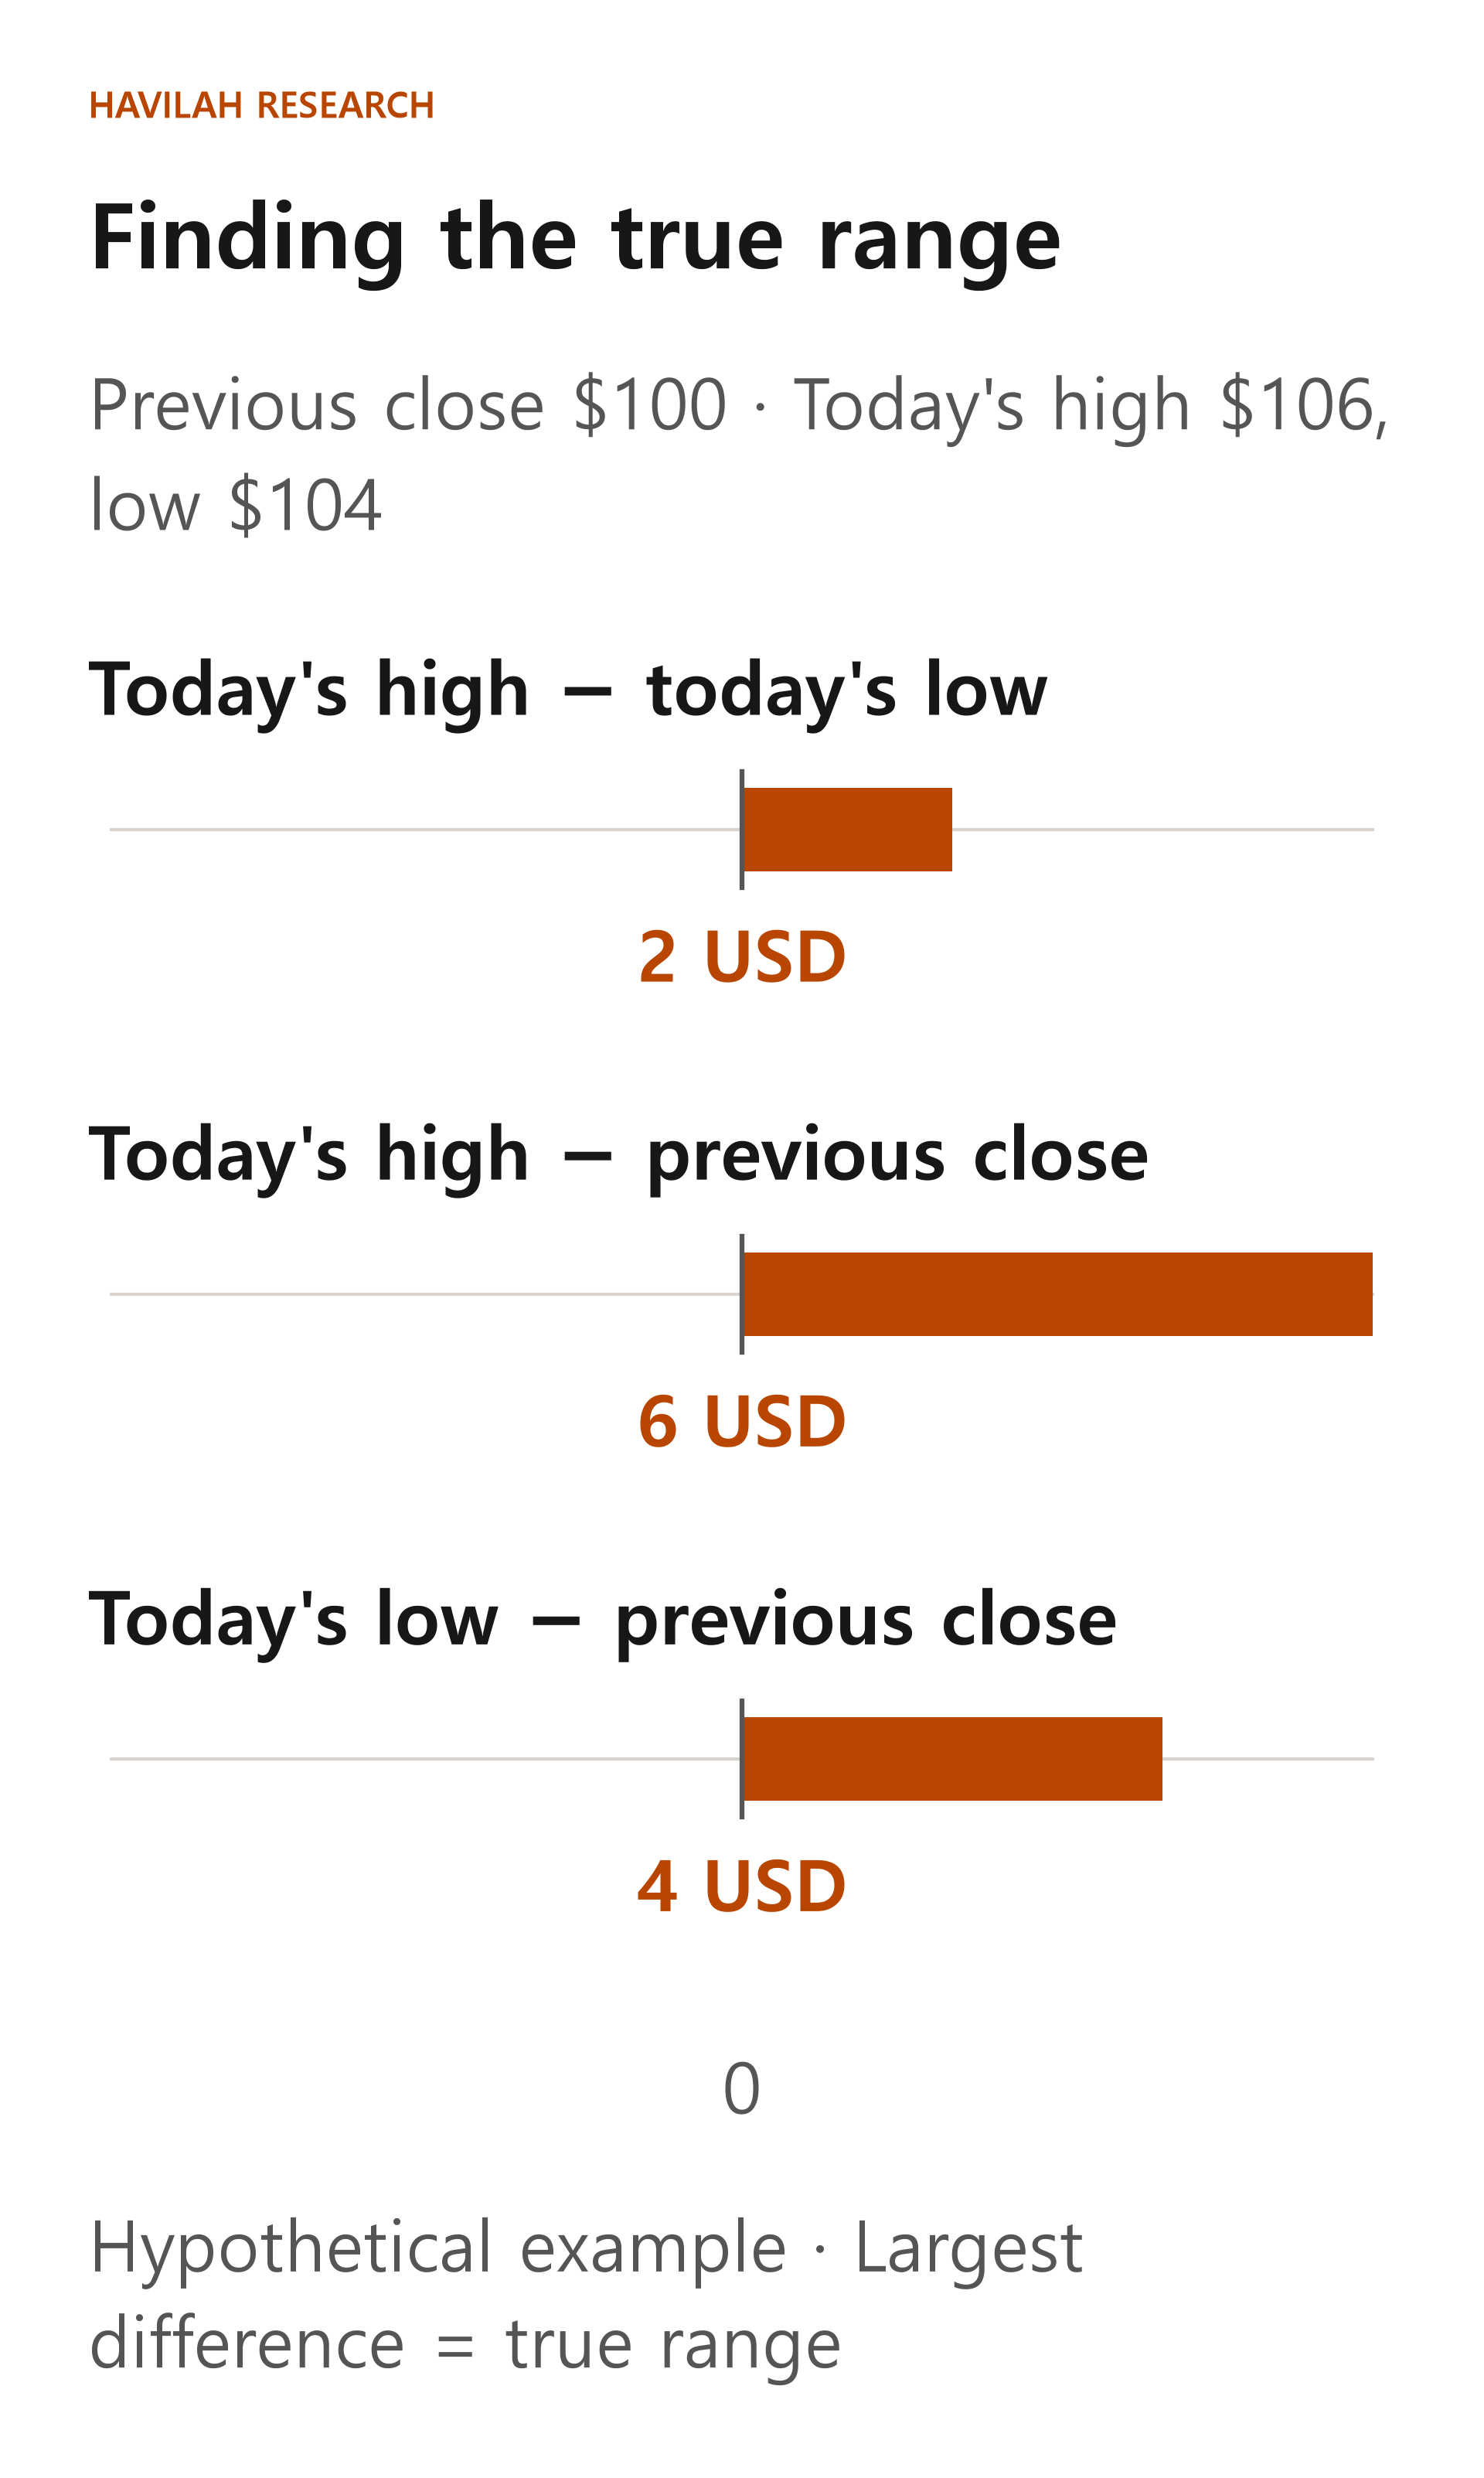
Assume the previous close was $100 and that today the stock traded between a low of $104 and a high of $106. These are illustrative numbers, not real market data.
The difference between today's high and low is $2. The difference between the high and the previous close is $6, and the difference between the low and the previous close is $4. The largest of the three, $6, is today's true range. Compared with looking only at the $2 move within the day, it also captures the gap that opened up from the previous close.
Next, you combine this day's true range with the earlier values to update the average. Real charts commonly use a 14-period ATR. Here we assume 3 periods to keep the calculation easy to follow.
Assume that the 3-period ATR calculated up to the previous day was $3. To get the new ATR, multiply the previous ATR by 2, add today's true range and divide by 3. So (3 × 2 + 6) ÷ 3 = $4. This is an example of a method that updates the value using the previous ATR, and the result can differ from simply adding up the last three ranges and dividing by 3. Check each chart's calculation method and starting value.
When you think about how many shares to buy
Now assume that, at a different hypothetical point in time, you buy a stock at $100 and its ATR at that time is $4. You could set $92, which is $8 (twice the ATR) below your purchase price, as the level at which you will consider a stop-loss. Twice the ATR is a choice made to show the calculation; it is not the right answer for every stock.
Suppose you plan to accept a loss of $80 on this trade, and that your buy and sell orders are filled at $100 and $92. The price difference per share is $8, so 80 ÷ 8 = 10 shares. To buy 10 shares at $100, you need $1,000, not counting commissions.
This does not mean you must buy the number of shares you calculated. If the cash you can use, or the limit you set for any one stock, is smaller, you need to reduce the number further. Commissions, currency conversion costs and other costs also have to be considered separately.
You may not be able to sell at the price you planned
The $92 level is the reference price set in the example above, not a cap on your loss. When the market opens, the share price could skip past $92 and land at $88. If, for example, you sold all 10 shares at $88, your loss before commissions and other costs would be (100 − 88) × 10 = $120. That is larger than the $80 you planned.
A stop-loss order does not guarantee the fill price either. With an order type that becomes a market order once its condition is met, the actual fill price can end up below the reference price. With an order type that, once its condition is met, sells only at or above a price you specify, the order may not be filled at all if the price falls quickly. Check with your broker which order types it offers and how they work.
What not to miss when you read ATR
A rising ATR means that recent price moves have grown larger, not that the price is about to rise. Both sharp rises and sharp falls can push ATR up. And because ATR is calculated from past prices, there is no guarantee that the next move will stay within that range.
A stock with a high share price can also show a large ATR in dollars. If you compare stocks, look not only at the dollar amount of ATR but also at its size relative to the share price. Above all, volatility alone cannot tell you a company's value or give you a reason to buy.
Use ATR as a starting point for planning your stop-loss level and number of shares, but also think about your reasons for investing, the money you will use and fills that may differ from what you expected. In the next lesson, we will look at price patterns that appear on charts, such as triangles and flags.