
A share price rises from $10 to $11. For a stock that usually moves only a few cents a day, that may be a big change. For a stock that moves $1 every day, it may be nothing special.
Bollinger Bands are lines that also show how widely recent prices have spread out from their average. You can use them to see where the share price stands compared with its recent movement.
The middle line and the lines above and below it
Bollinger Bands are made up of three lines. The middle line is a moving average of the closing prices over a set period. The closing price is the price at the end of regular trading on a given trading day.
The upper and lower lines sit a certain distance away from the middle line. That distance is set using a number called the standard deviation. Here, the standard deviation shows how far recent closing prices have been from their average. It gets smaller when prices cluster close to the average and larger when they spread far from it.
A common setup uses a 20-period simple moving average as the middle line and draws lines above and below it at twice the standard deviation. On a daily chart, this usually means the closing prices of the latest 20 trading days. Users can change the period and the multiple, so start by checking the chart's settings.
Calculating them yourself with four prices
To keep things simple, assume the closing prices on four hypothetical trading days are $9, $9, $11 and $11. This is an illustrative example, shorter than the 20-day setting commonly used in practice.
First, add the four prices and divide by 4. The average is $10. This average is the middle line.
Each price is $1 below or $1 above the average. To find the standard deviation, you first square each difference from the average. In this example, all four squared differences are 1. Their unit is "dollars squared," because squaring a dollar amount also squares its unit. Add them up and divide by 4, the number of prices, and you get 1 dollar squared. Take the square root of that, and the standard deviation is $1. A square root is the calculation that finds the value you had before squaring.
Adding twice the standard deviation, $2, to the average gives an upper line of $12. Subtracting $2 from the average gives a lower line of $8.
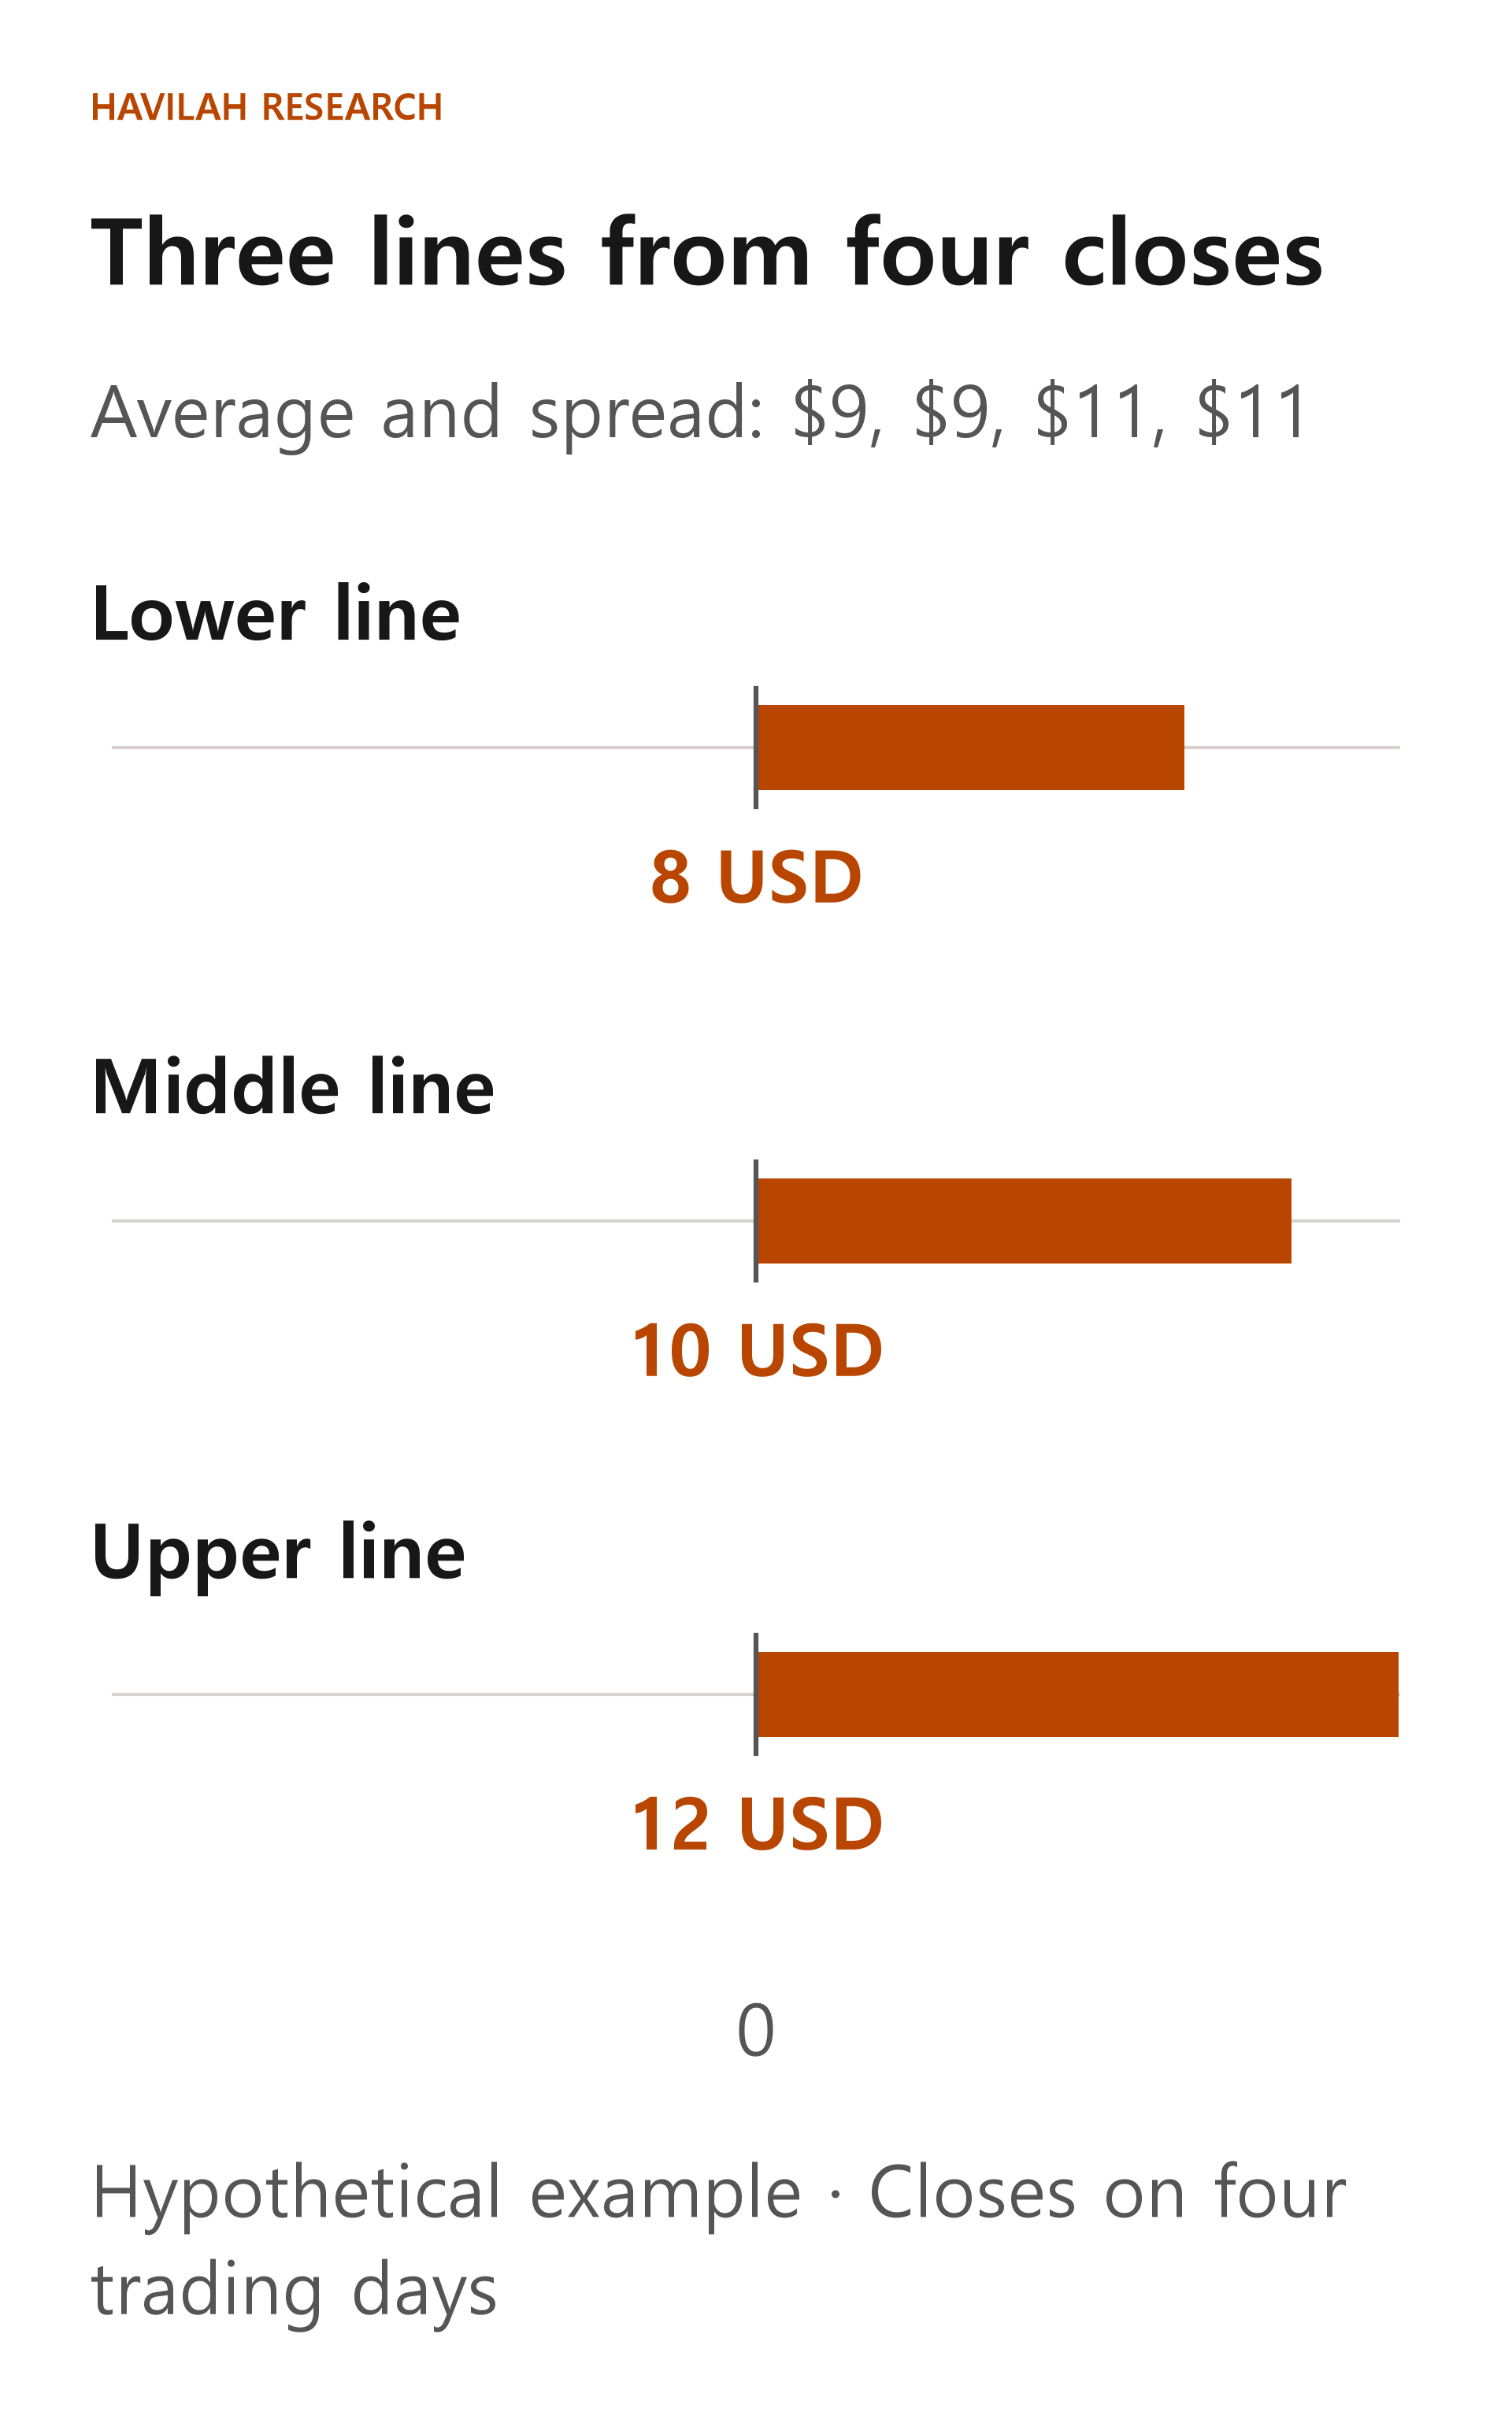
The last close, $11, is above the middle line of $10 but has not reached the upper line of $12. The figure shows the lines at one point in time, calculated from the information available up to the fourth close.
What changes when the space between the lines widens?
When recent closing prices spread far from their average, the standard deviation grows, and the space between the upper and lower lines generally widens. Conversely, when closing prices cluster near the average, the bands narrow.
However, the width of the bands is a number that shows how spread out the price levels were over the chosen period. It does not mean the same thing as the standard deviation of daily returns or the size of future losses. Even when a share price rises steadily in one direction, the bands can widen if recent prices spread far from their average.
Be careful, too, when you compare band widths across stocks with different prices. If you compare only band widths in dollars, a stock with a higher share price can look as if its bands are wider. Even for the same stock, a comparison means more when the period and the multiple are set the same way.
Should you sell when the price touches the upper line?
Touching the upper line does not mean you have to sell. When a share price rises strongly, it can keep climbing along the upper line or move above it. Likewise, the price can keep falling even after it touches the lower line.
Nor does the price always stay inside the bands. The upper and lower lines are not walls that stop prices; they are reference lines calculated from recent prices. Using twice the standard deviation does not fix the probability that future prices will stay between the lines.
When the bands narrow, you cannot know the direction in advance either. They may stay narrow for a while, or the price may later make a big move up or down.
What else to check when you use them in practice
When you see Bollinger Bands on a chart, first check the period, the multiple, and whether it is a daily or a weekly chart. Then, rather than looking only at whether the price touched a line, also look at the trend and volume you learned about earlier. It is worth checking, too, whether an earnings release or important news about the company is coming up.
For example, instead of selling automatically because the price moved above the upper line, check whether the uptrend is holding and whether your reasons for investing have changed. If you decide to buy or sell, think in advance about what you will do if you turn out to be wrong and how much loss you can bear.
When the closing prices used in the calculation change, the positions of all three lines change too. The $12 calculated in the hypothetical example above is not a price that stays fixed the next day. Bollinger Bands are a tool that supports your judgment, not a trading rule that guarantees profits.
In the next lesson, we will learn about ATR, which looks at how much the price moved in a day, and see how to use it when you think about how much to invest and how much risk to take.