
When you look at charts, you sometimes see two lines and a set of bars below the price. One of these displays is MACD (moving average convergence divergence). Before you rush to buy or sell because the lines have crossed, let's first look at what each of them calculates.
MACD is a tool for looking at how far apart moving averages over different periods are. It compares recent price movement with movement over a somewhat longer period, and it is used to look for clues that something is changing. It is not a number that tells you future share prices precisely.
Looking at the gap between two moving averages
In Lesson 160, you learned that a simple moving average gives every price in a set period equal weight. MACD usually uses the exponential moving average, which gives more weight to recent prices. It is abbreviated as EMA.
In a commonly used setting, the 26-period EMA is subtracted from the 12-period EMA. On a daily chart, these are calculated over 12 trading days and 26 trading days. The difference you get is the MACD line. You can change the periods on a chart, so check the settings before you compare.
On a hypothetical day, suppose the 12-day EMA is $12 and the 26-day EMA is $10. Assume both averages have already been calculated from earlier prices. The MACD is then 12 − 10 = $2. This means that the short-period average is $2 higher than the long-period average.
A MACD above 0 does not by itself mean that the share price rose today. It is the result of comparing where the two averages stand right now. Also, because MACD is a difference in price, it is hard to compare the numbers side by side for stocks whose prices are at very different levels.
What are the signal line and the bars?
Charts also show a signal line, which averages the movement of the MACD line once more. In the usual setting, the signal line is the 9-period EMA of the MACD line. It averages the values of the MACD line, not nine closing prices. The 9 periods set how the average is updated, and earlier values are still partly reflected through the previous EMA.
In the same hypothetical case, assume that the signal line, calculated from the earlier MACD values, is $1.50. Its difference from the MACD of $2 found above is 2 − 1.5 = $0.50. The bars on the chart, called the histogram, show exactly this difference: the MACD line minus the signal line.
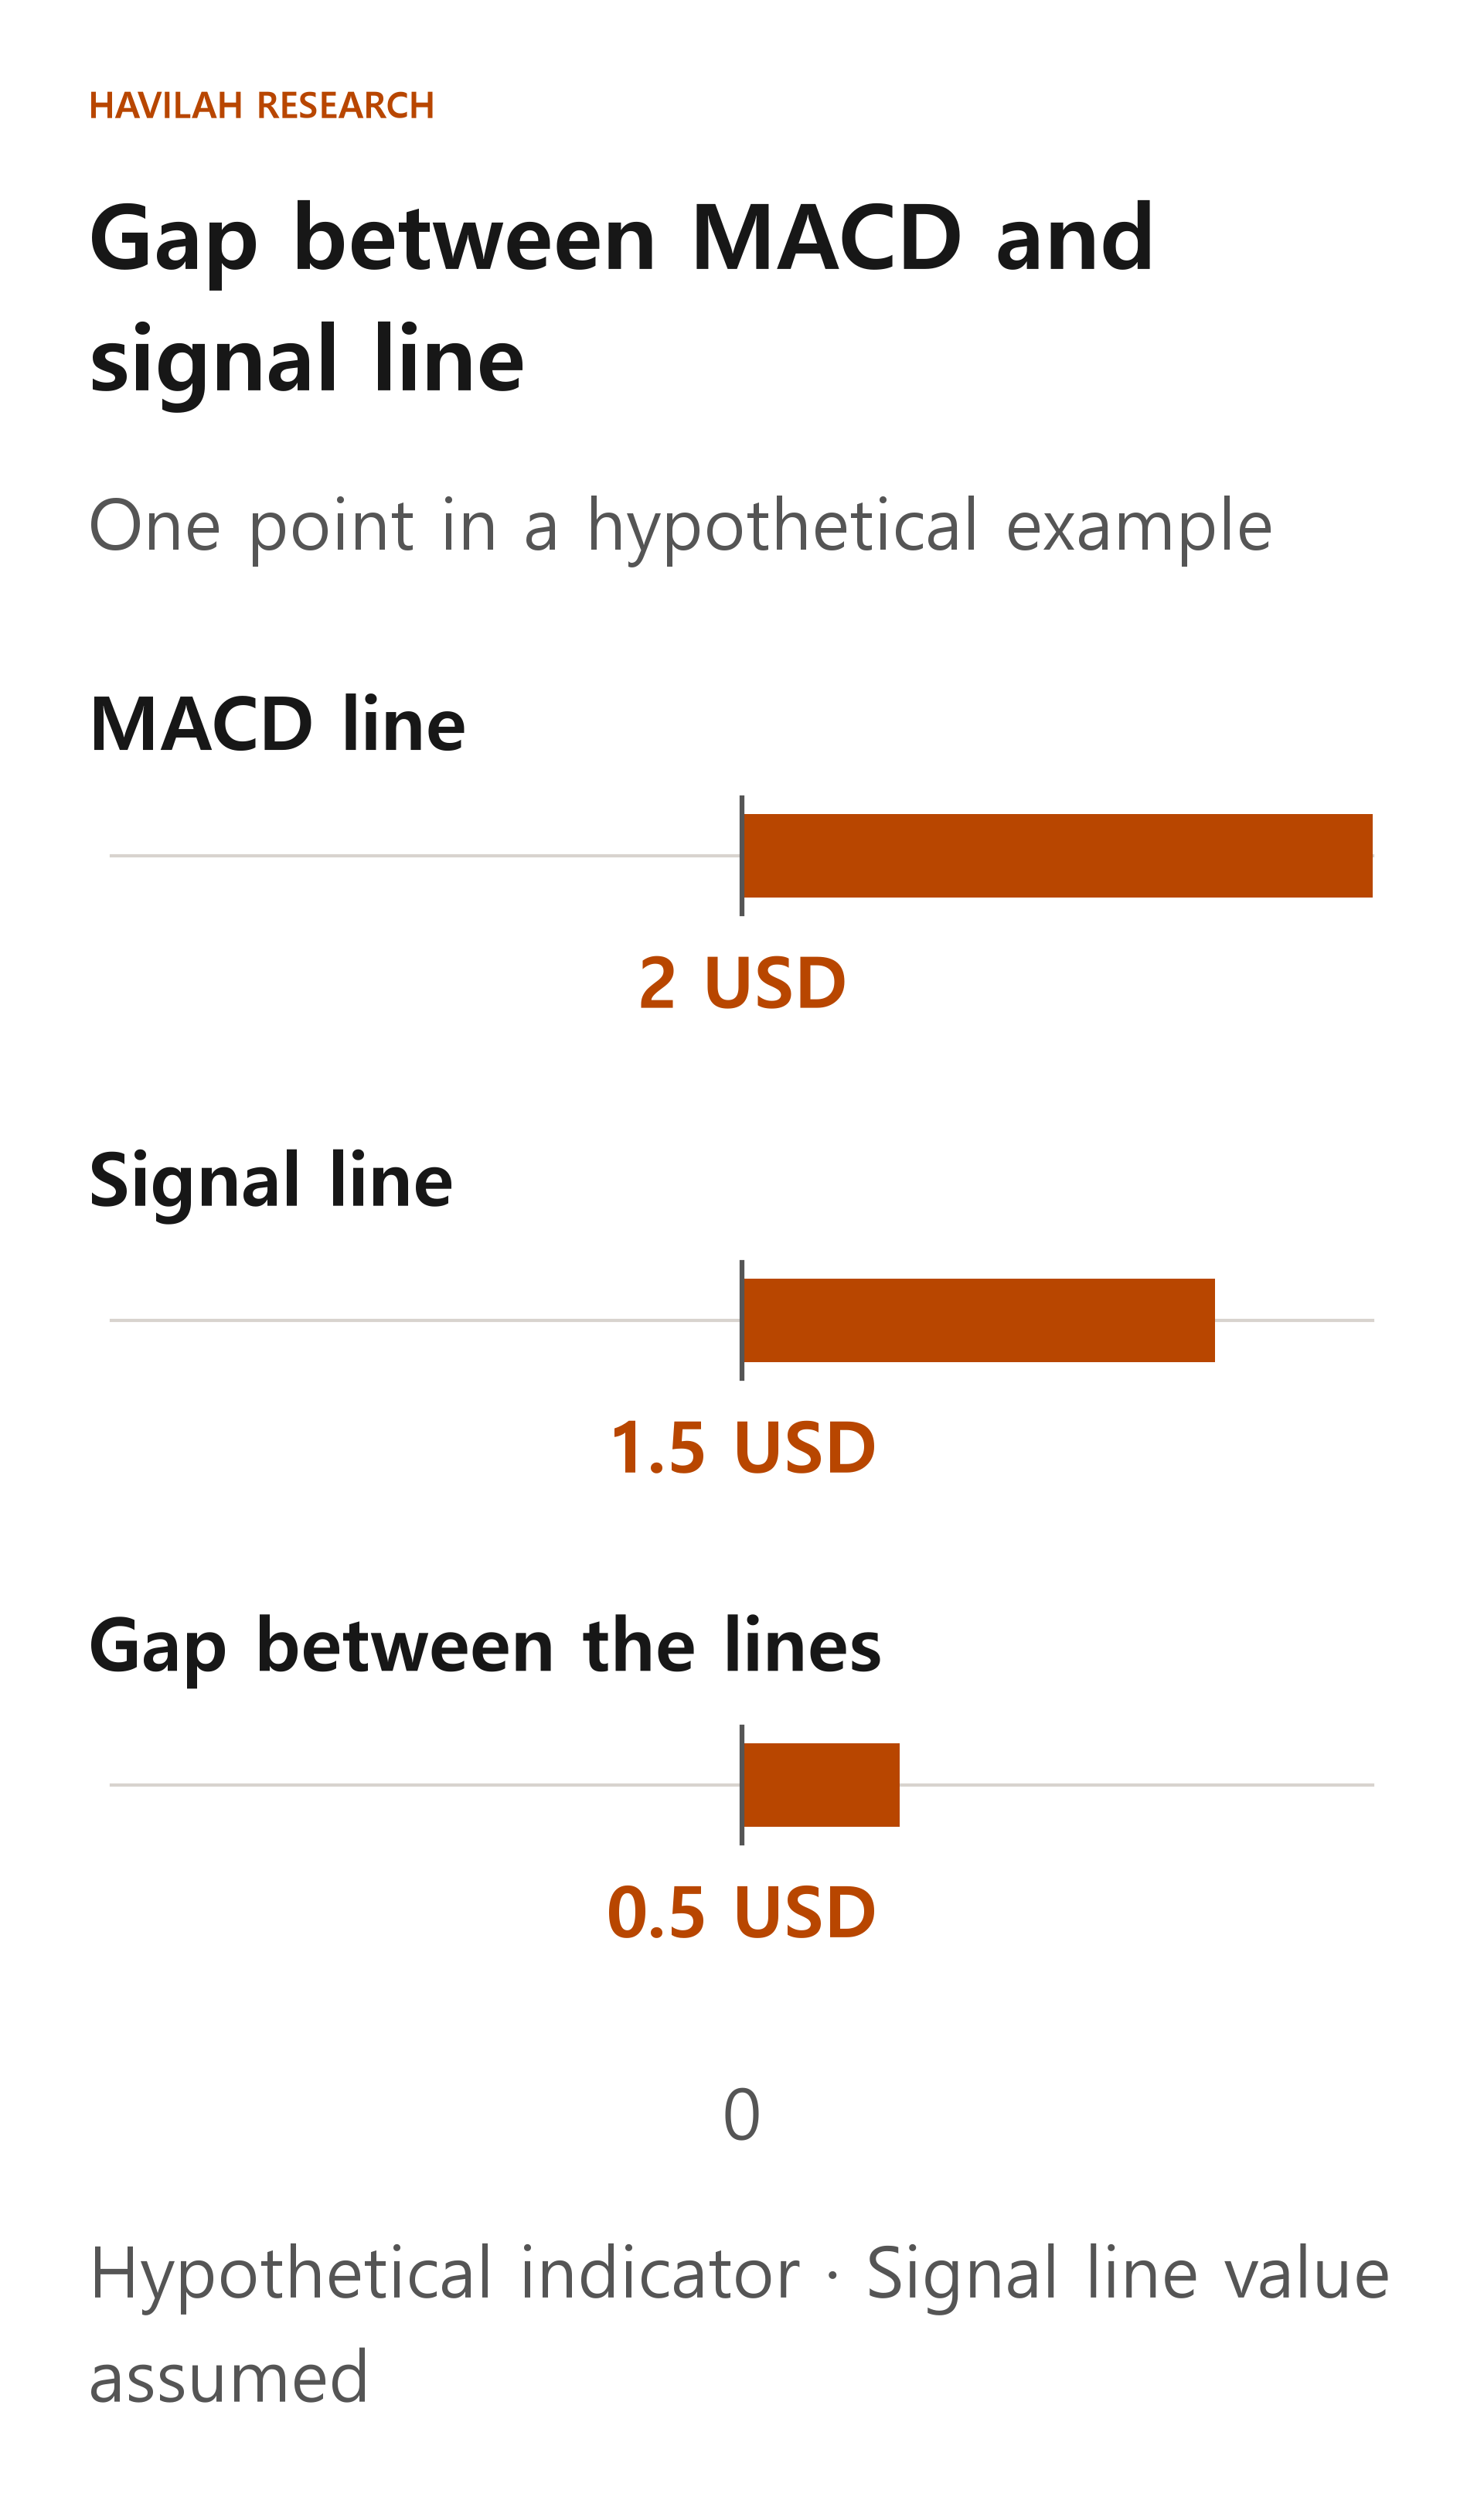
In this example, the bar is above 0. That means the MACD line is above the signal line. If the bar is below 0, the MACD line is below the signal line. The size of the bar is the gap between the two lines. It is not the share price's rate of increase or an investment return.
What does it mean when the two lines cross?
When the MACD line moves from below the signal line to above it, this is called an upward crossover. Some investors use it as a prompt to look into whether recent price movement may be improving. Conversely, when the MACD line moves from above the signal line to below it, this is called a downward crossover.
A crossover of the two lines is also not the same as the MACD line moving above 0. If the signal line is below 0, the MACD line can cross above the signal line while it is still below 0. In that case, the short EMA can still be lower than the long EMA. Do not mix up these two different comparisons.
Even when a crossover appears, the share price will not necessarily move in that direction the next day. When the price moves up and down within a narrow range, the two lines can also cross back and forth often. If you buy and sell every time the signal changes, trading costs and wrong calls can keep adding up.
When the price and the indicator move differently
If the share price rises above its previous high but the MACD's high is lower than its previous high, the price and the indicator are pointing in different directions. This is called a divergence. Some investors use it to look into whether the uptrend might change.
But a divergence alone cannot tell you when a decline will start. The share price can keep rising even if the indicator looks weak, and it can fall further even if the indicator seems to be improving. Highs and lows can often be confirmed only after you see what happens next, so do not assume you could have known at the time what a chart completed later shows.
How should you use it when you invest?
First, check whether the chart is daily or weekly and which periods are set for MACD and the signal line. If chart providers adjust prices differently or start their averages differently, their values can differ slightly.
Next, rather than looking at one line alone, also check whether the price is rising, falling or moving sideways, and whether the company's results or outlook have changed. If you use it for trading, it is better to decide in advance when you will review your judgment, how much you will invest and how much loss you can bear.
MACD is the difference between averages built from past prices. A crossover or a divergence is only a clue that calls for further checking. It does not guarantee a company's value or future returns.
In the next lesson, we will learn about Bollinger Bands, which show how widely the price has moved around its average.