
Suppose you bought a stock today at $11. You might wonder how that price compares with the other prices at which the stock traded today. One number people look at for this is the volume-weighted average price, or VWAP for short.
The name is long, but the idea is simple. It is the average trade price, calculated with more weight on the prices at which more shares changed hands. It reflects not only the prices at which the stock traded but also how many shares traded at each price.
Weighting the average by the number of shares
Assume that a hypothetical stock traded only the three times shown below during one day. In a real market, a huge number of trades take place at different prices and in different quantities.
| Trade | Price per share | Shares traded | Trade value |
|---|---|---|---|
| First | $10 | 100 shares | $1,000 |
| Second | $12 | 200 shares | $2,400 |
| Third | $11 | 100 shares | $1,100 |
| Total | Differs for each trade | 400 shares | $4,500 |
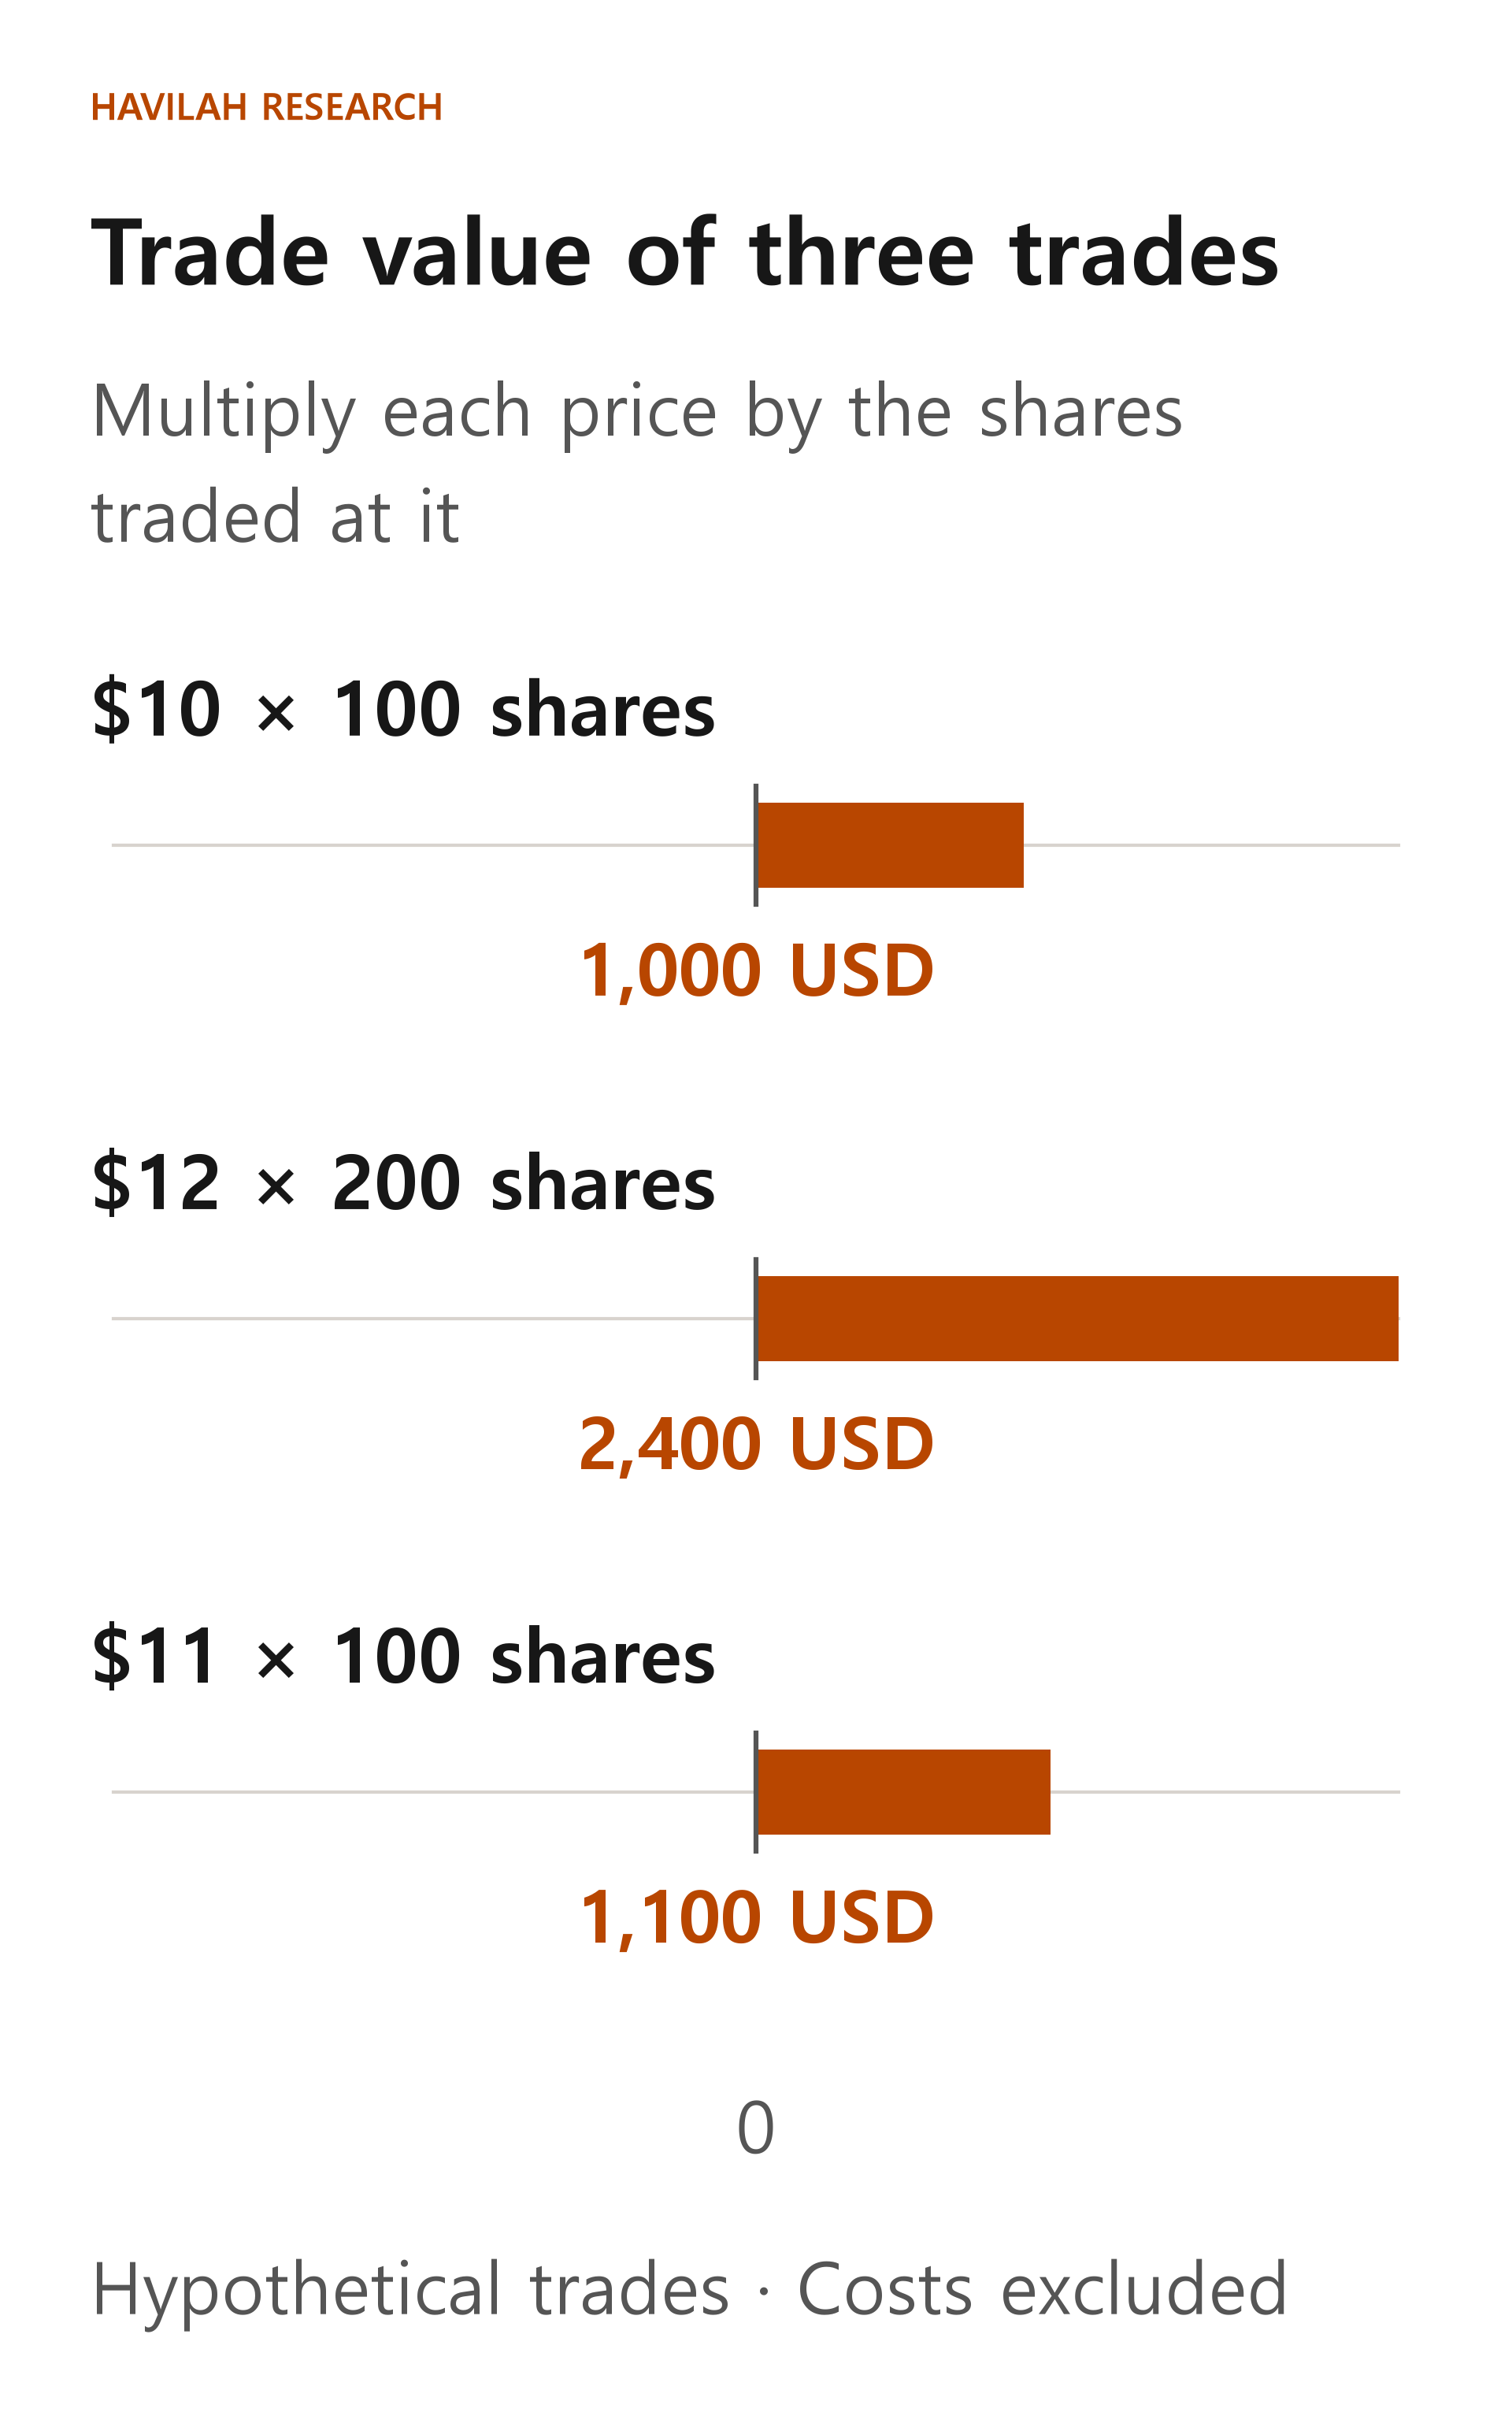
Multiply each trade's price by its number of shares and add up the results, and you get $4,500. The number of shares traded is 400. Then 4,500 ÷ 400 = $11.25, which is the VWAP for all of these hypothetical trades. Commissions and taxes are not included.
If you simply add up the three prices and divide, you get (10 + 12 + 11) ÷ 3 = $11. But twice as many shares traded at $12 as at each of the other prices, so the volume-weighted average is $11.25. The moving average of closing prices you learned about in Lesson 160 is different from this calculation, because it averages the closing prices of a set number of trading days.
How does a day's VWAP move?
Some charts show VWAP based on the trades from the start of the regular session up to the present moment. When a new trade happens, its trade value and its number of shares are each added to the running totals, and the average is updated. On the next trading day, the calculation starts over for that day.
In the example above, the average right after the first trade is $10. Including the second trade, a total of $3,400 divided by 300 shares gives about $11.33. When the third trade is added, it becomes $11.25. The VWAP you see during the trading day can change with the trades that follow.
The result depends on which trades, from when to when, are included. You can look at the regular session only, and some settings also include extended-hours trading. Also check which exchanges are covered and how the chart provider does the calculation. Some charts approximate VWAP using a representative price and the volume of each time-interval bar instead of individual trades, so the value can differ from one calculated directly from every trade.
You can also change the starting point
Some investors start collecting trades not at the start of the day but at the moment an event they care about took place, such as an earnings release, and calculate the average from there. This method of fixing a starting point is called anchored VWAP. You can think of the "anchor" as the fixed reference point the calculation starts from.
In the earlier hypothetical example, if you take the second trade as the starting point, you include only the second and third trades. $2,400 plus $1,100 is $3,500, and dividing that by 300 shares gives about $11.67. That differs from the $11.25 calculated from the first trade, because the starting point is different.
The investor chooses the starting point. If you pick the date that looks best after the fact, the line can look more special than it really is. Write down which event you used as the starting point and why, and check that your judgment relied only on information that was known at that time.
How do institutions use this price?
Institutional investors sometimes split a large trade into many smaller trades rather than trading all the shares at once. In such cases, some compare their own average fill price with the same stock's VWAP over a set period. VWAP can serve as one benchmark for reviewing how well trades were executed.
The next case is a separate hypothetical example, unrelated to the trades above. Suppose that over the same period an investor bought 400 shares at $11.20, and the remaining 400 shares traded in the market were filled at an average of $11.30. Including this investor's trade, the trading value of all 800 shares is $4,480 plus $4,520, or $9,000, and the market VWAP is 9,000 ÷ 800 = $11.25. The investor's purchase price is $0.05 per share below the market VWAP, or $20 lower across all 400 shares. This comparison leaves out commissions, currency conversion costs and the effect the order itself had on the market price.
This comparison alone does not mean the investor made the right call or that a good return is locked in. A different period would give a different comparison, and you also need to look separately at any shares the investor could not buy and at how the price moved before the decision to buy. Nor should you judge a trade as if the full-day VWAP, which is only final after the market closes, had been known in advance during the day.
If the price is below the line, is the stock always cheap?
No. A current price below VWAP means the current price is lower than the average price at which the stock traded over a set period. It does not mean the stock is undervalued compared with the company's future earnings. If new information comes out, such as worse results, the price can keep falling even after it has dropped below the average.
When you look at a stock you are interested in, first check where the VWAP calculation starts and ends, whether it covers the regular session only or extended hours as well, and whether it uses individual trades or bars. Then look at the current price, volume, changes at the company and your own plan for handling losses, all together. An average is a tool that summarizes past trades. It does not guarantee future prices.
In the next lesson, we will look at the RSI, which compares recent price rises with recent price falls.