
Share prices go up and down every day. If you try to follow every daily move, it can be hard to see which way recent prices are heading overall. One way to look at this is to average the prices over a set period. That is what a moving average does.
A moving average is not a line that tells you future prices. It is a tool that organizes prices that have already happened, so that the recent direction is easier to see.
Start by calculating a five-day average
Suppose a hypothetical stock finished trading at $10, $11, $12, $13 and $14 over five days. The price at which a day's trading ends is called the closing price.
The five closing prices add up to $60. Divide that by 5, the number of trading days, and the average is $12. This average is called the 5-day simple moving average on the fifth trading day. "Simple" means that the five prices are added with equal weight.
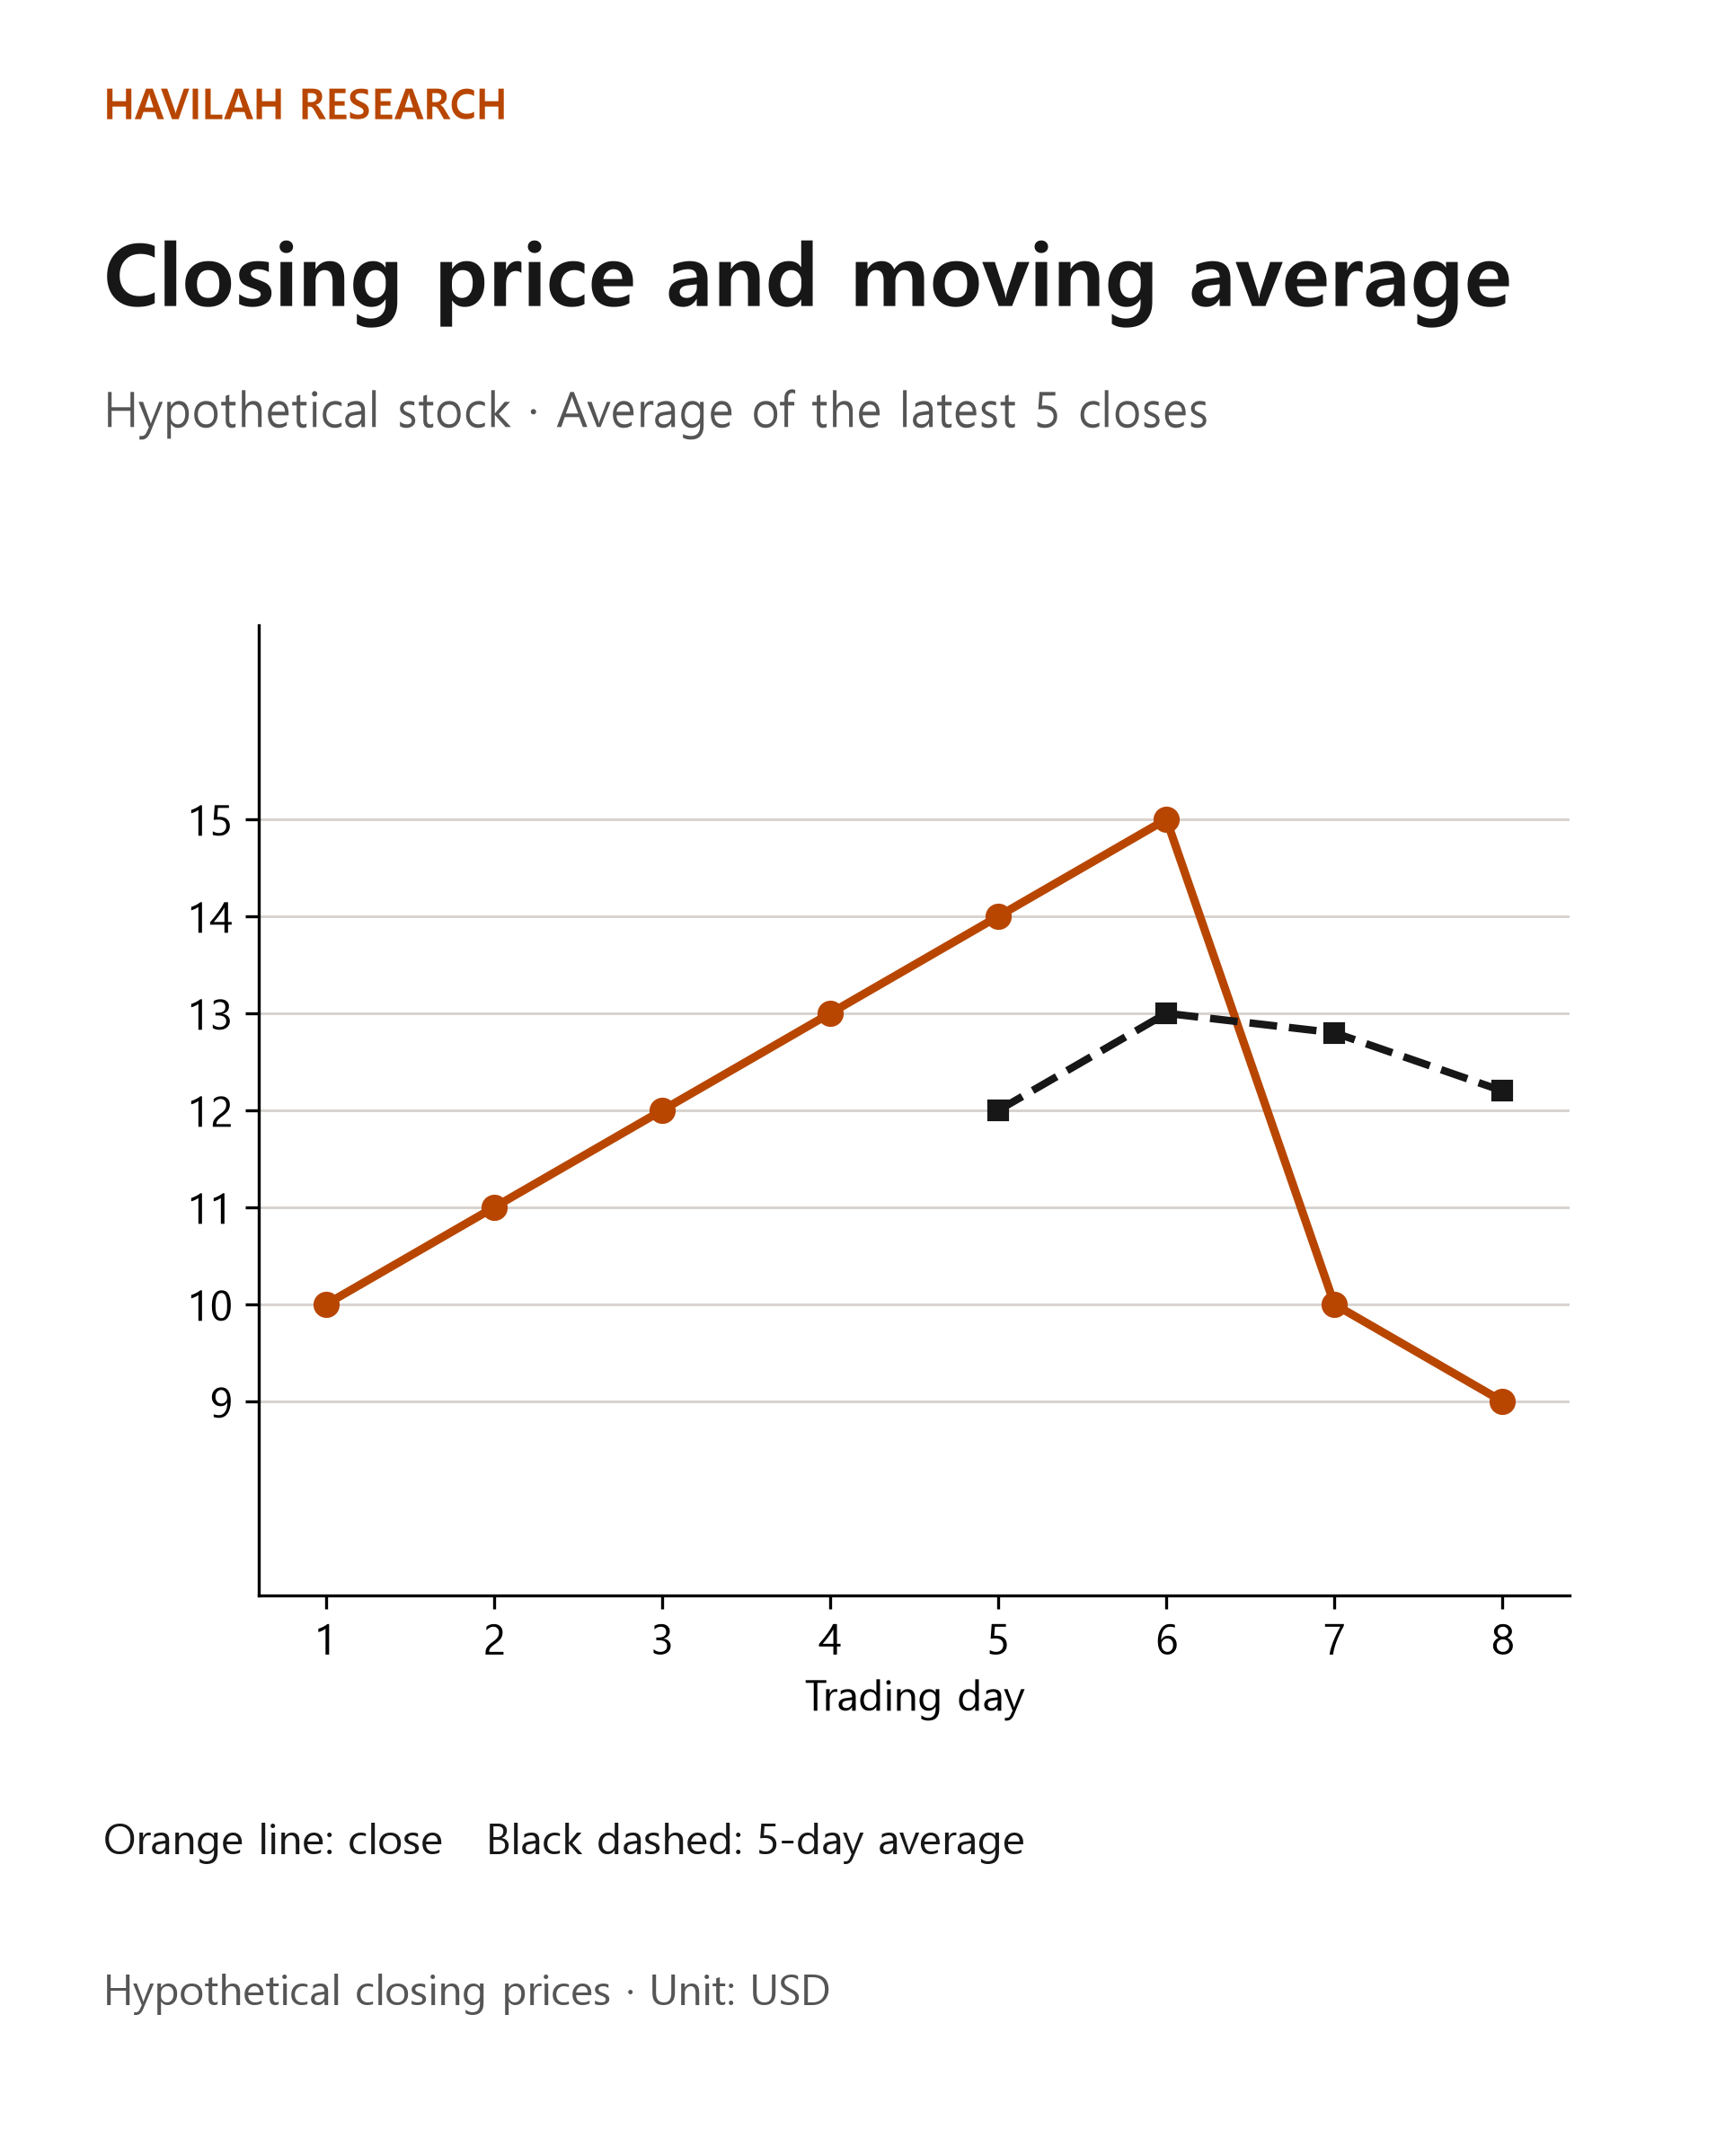
What happens if the closing price on the sixth trading day is $15? You still look at only the latest five trading days, so the oldest price, $10, drops out and the new $15 comes in. The remaining prices, $11, $12, $13, $14 and $15, add up to $65, and their average is $13.
Each time a new trading day is added, you calculate the average in the same way and connect the results on the chart. That line is the moving average. A 5-day average needs five closing prices, so the figure has no average line for the first four trading days. On weekends and market holidays there is no new regular-session closing price, so you count trading days, not calendar days.
The average moves slowly even when the price falls
Suppose that after the sixth day's close of $15 and a 5-day average of $13, the seventh close drops to $10. The latest five closes are now $12, $13, $14, $15 and $10. Their total, $64, divided by 5 gives an average of $12.80.
The daily close fell sharply, from $15 to $10, but the average still contains the prices of the previous four days, so it falls only from $13 to $12.80. It can take time for a sharp price change to show up fully in the average. This is why a moving average is described as an indicator that trails behind past prices.
If the eighth close in the figure is $9, the latest five closes are $13, $14, $15, $10 and $9. Their total, $61, divided by 5 gives an average of $12.20. Remember that each time a new close is added, the oldest close drops out at the same time.
How do the 20-day, 50-day and 200-day lines differ?
The 20-day simple moving average is the average of the closing prices of the latest 20 trading days, each given equal weight. The 50-day and 200-day lines are calculated the same way, only over different periods. They are not the same as 20, 50 or 200 calendar days, because no regular-session close is added on days when the market is closed.
An average over a short period tends to react relatively quickly to recent price changes. An average over a long period mixes in more past prices, so it tends to move more gently. But the longer line is not always more accurate, and the shorter line is not always more useful. Choose the period that fits your investment horizon and the question you want to answer.
Besides the simple moving average, charts also offer the exponential moving average, which gives more weight to recent prices. Even if two lines are both labeled "20-day," their values can differ if they are calculated differently. The calculations in this lesson use simple moving averages. If you use an exponential moving average, check your chart settings separately.
What does it mean when the lines cross?
Some investors look at whether the price is above the moving average and which way the line is moving. Another approach is to watch for the moment when a shorter-period average crosses above or below a longer-period average. This is called a crossover.
For example, if the 20-day line crosses the 50-day line from below, the average price of the latest 20 days has risen above the average of the latest 50 days. You can treat this as a clue that the pattern of past prices has changed, but there is no guarantee that the price will keep rising from that point on.
When the price moves up and down within a range, it can cross above and below the average line again and again. If you buy and sell mechanically every time, you may end up making trades you did not want, over and over. The more you trade, the more your results are affected by commissions, taxes and fills at prices different from what you expected.
What to check before you use it in your investing
On the chart of a stock you are interested in, first check which prices and which period the line is calculated from. The values on a chart can differ depending on whether it uses regular-session closing prices and whether past prices have been adjusted for dividends or stock splits. If the market has not closed yet, that day's closing price and the average line can still change.
A rising average line is not evidence that the company's business has improved. And a price that falls below the average line does not mean the company's value has dropped by the same proportion. Look at the company's results, its business outlook, your reasons for investing and the risk you can bear, all together.
A moving average summarizes past prices. Use it knowing which period it averages, but it is important not to feel certain about future returns based only on the direction of a line or a crossover. In the next lesson, we will look at how to calculate an average trade price that takes into account how many shares were traded.