
You are looking at a stock and see a number called the RSI showing 75. The screen also shows the word "overbought." The stock has already risen a lot, so should you sell right away?
A high RSI means that recent price gains have been stronger than recent price declines. It is not a promise that the share price will fall. In fact, during a strong uptrend, the RSI can stay high for a long time while the price keeps rising.
What does the RSI compare?
RSI stands for Relative Strength Index. It looks at a stock's recent price changes, compares the size of the gains with the size of the losses, and expresses the result as a number from 0 to 100. On daily charts it is often based on the price changes over 14 trading days, but you can change the period.
It is different from the "relative strength against the market" covered in Lesson 159. Relative strength against the market compares a stock with something else, such as a market index. The RSI uses one stock's own recent gains and losses.
Let's calculate it with small numbers
To make it easier to follow, let's look at a hypothetical case that uses only four price changes instead of the usual 14 days. Suppose the closing prices are $10, $12, $11, $13 and $12, in that order. Five closing prices give four changes.
| Change | Change in closing price | Gain | Loss |
|---|---|---|---|
| First | $10 → $12 | $2 | $0 |
| Second | $12 → $11 | $0 | $1 |
| Third | $11 → $13 | $2 | $0 |
| Fourth | $13 → $12 | $0 | $1 |
The gains add up to $4 and the losses add up to $2. Dividing each by the four changes gives an average gain of $1 and an average loss of $0.50. On a day when the price did not rise, the gain is counted as 0, and on a day when it did not fall, the loss is counted as 0.
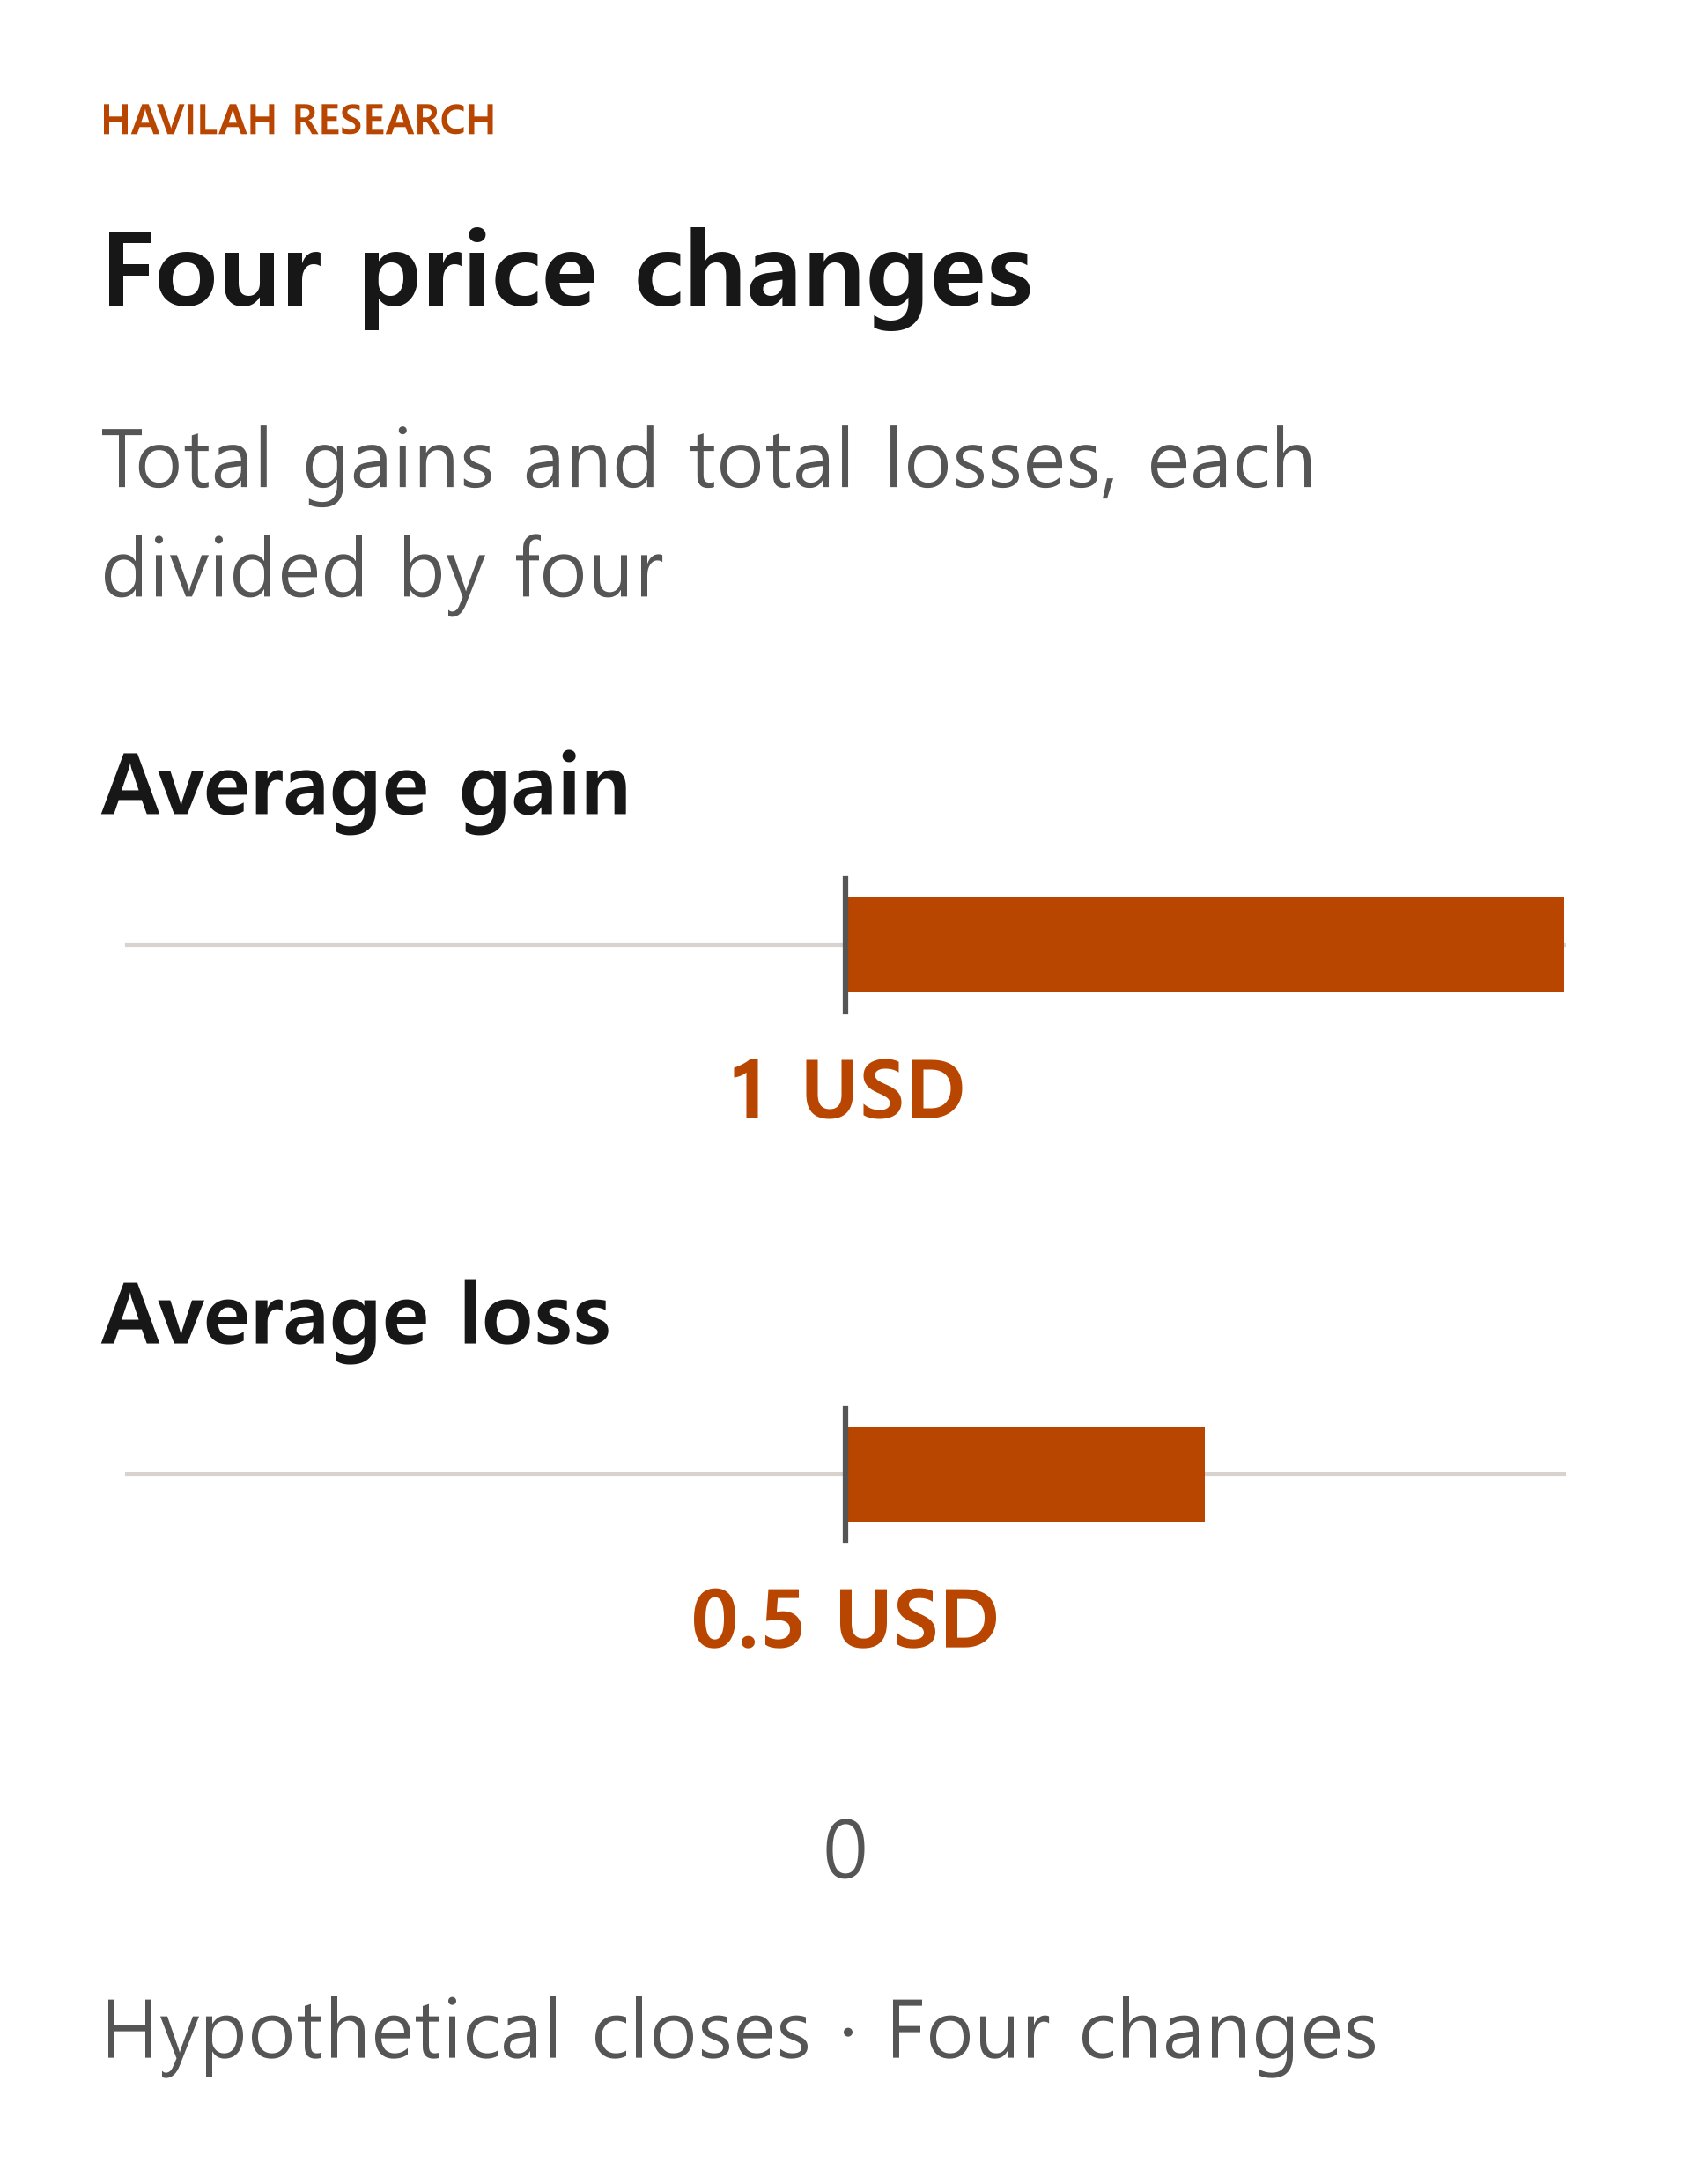
Divide the average gain by the average loss: 1 ÷ 0.5 = 2. You then put this ratio into the formula.
RSI = 100 − 100 ÷ (1 + 2) = about 66.67
This number places the relationship between the gains and the losses on a scale from 0 to 100. It does not mean there is a 66.67% probability that the share price will rise. Nor does the 4-day setting in this hypothetical example mean that it is the best period for real investing.
How does it change when a new price comes in?
After the first calculation, the way the RSI is updated can differ depending on the chart's settings. The widely used Wilder method updates the previous average smoothly, so that past values still count. Its results can differ from a method that takes a fresh simple average of the latest four changes each time.
In the 4-day example above, suppose the next close rises from $12 to $15, a gain of $3. Under the Wilder method, the new average gain is (previous average 1 × 3 + new gain 3) ÷ 4 = $1.50. The new average loss is (previous average 0.5 × 3 + new loss 0) ÷ 4 = $0.375.
The new ratio is 1.5 ÷ 0.375 = 4, and the RSI is 100 − 100 ÷ (1 + 4) = 80. On a real chart, the number can differ slightly depending on the period, price adjustments and how the averaging is started. When the average loss is 0, you cannot divide by 0, so also check how your chart provider handles that case.
What do 70 and 30 mean?
Many charts label an RSI above 70 as overbought and an RSI below 30 as oversold. Overbought means that recent price gains have been strong; it is not the result of calculating the stock's fair value. Oversold likewise means that recent declines have been strong, not necessarily that the price is cheap.
In a sideways market, where the price moves back and forth within a similar range for a while, the price may come down after a high RSI or bounce back after a low RSI. But once that range breaks, the price can behave differently from before. In a clear uptrend, the RSI can stay high even after it goes above 70, and in a downtrend it can keep falling below 30.
So 70 and 30 can be used as signals to look more closely, but they are not rules that say you must sell or buy based on the number alone. Results depend on how you apply these levels, and you can also lose money.
Applying it to real investing
First, check which period the RSI was calculated over, even for the same stock. An RSI over a short period can react more sharply to recent changes. Also check, together with the price chart, whether a high reading comes from a steady rise or from a sudden jump right after an earnings release.
If the RSI goes above 70, instead of concluding that the price will soon fall, recheck the reasons behind the recent strong rise, the company's results, and the investment horizon and risk you set in advance. The price can also keep falling when the RSI is below 30, so it is better not to decide to buy based on one low number alone.
The RSI is a summary of past price changes. It does not tell you the company's value directly, and it does not guarantee future returns. Once you understand how to read the number, use it together with other information.
In the next lesson, we will look at MACD, which compares moving averages of different lengths.