
A stock you are interested in rose 10% in a month. Is that a good result? If the market as a whole rose 5% over the same period, this stock rose more than the market. If the market rose 20%, on the other hand, the stock went up but rose less than the market.
Comparing one stock's movement with the market or with other investments in this way is called looking at relative strength. How much a stock moved on its own and how much it moved compared with a benchmark are different questions.
Compare from the same starting point
Let's compare a hypothetical stock with a market index. The stock's price went from $100 to $110. Assume the market index went from 100 points to 105 points over the same period.
The stock rose 10 ÷ 100 × 100 = 10%, and the index rose 5 ÷ 100 × 100 = 5%. The difference between the two returns is 10% − 5% = 5 percentage points. A percentage point is the unit for the difference you get when you subtract one percentage from another. Here we compare only price changes, leaving out dividends and fees.
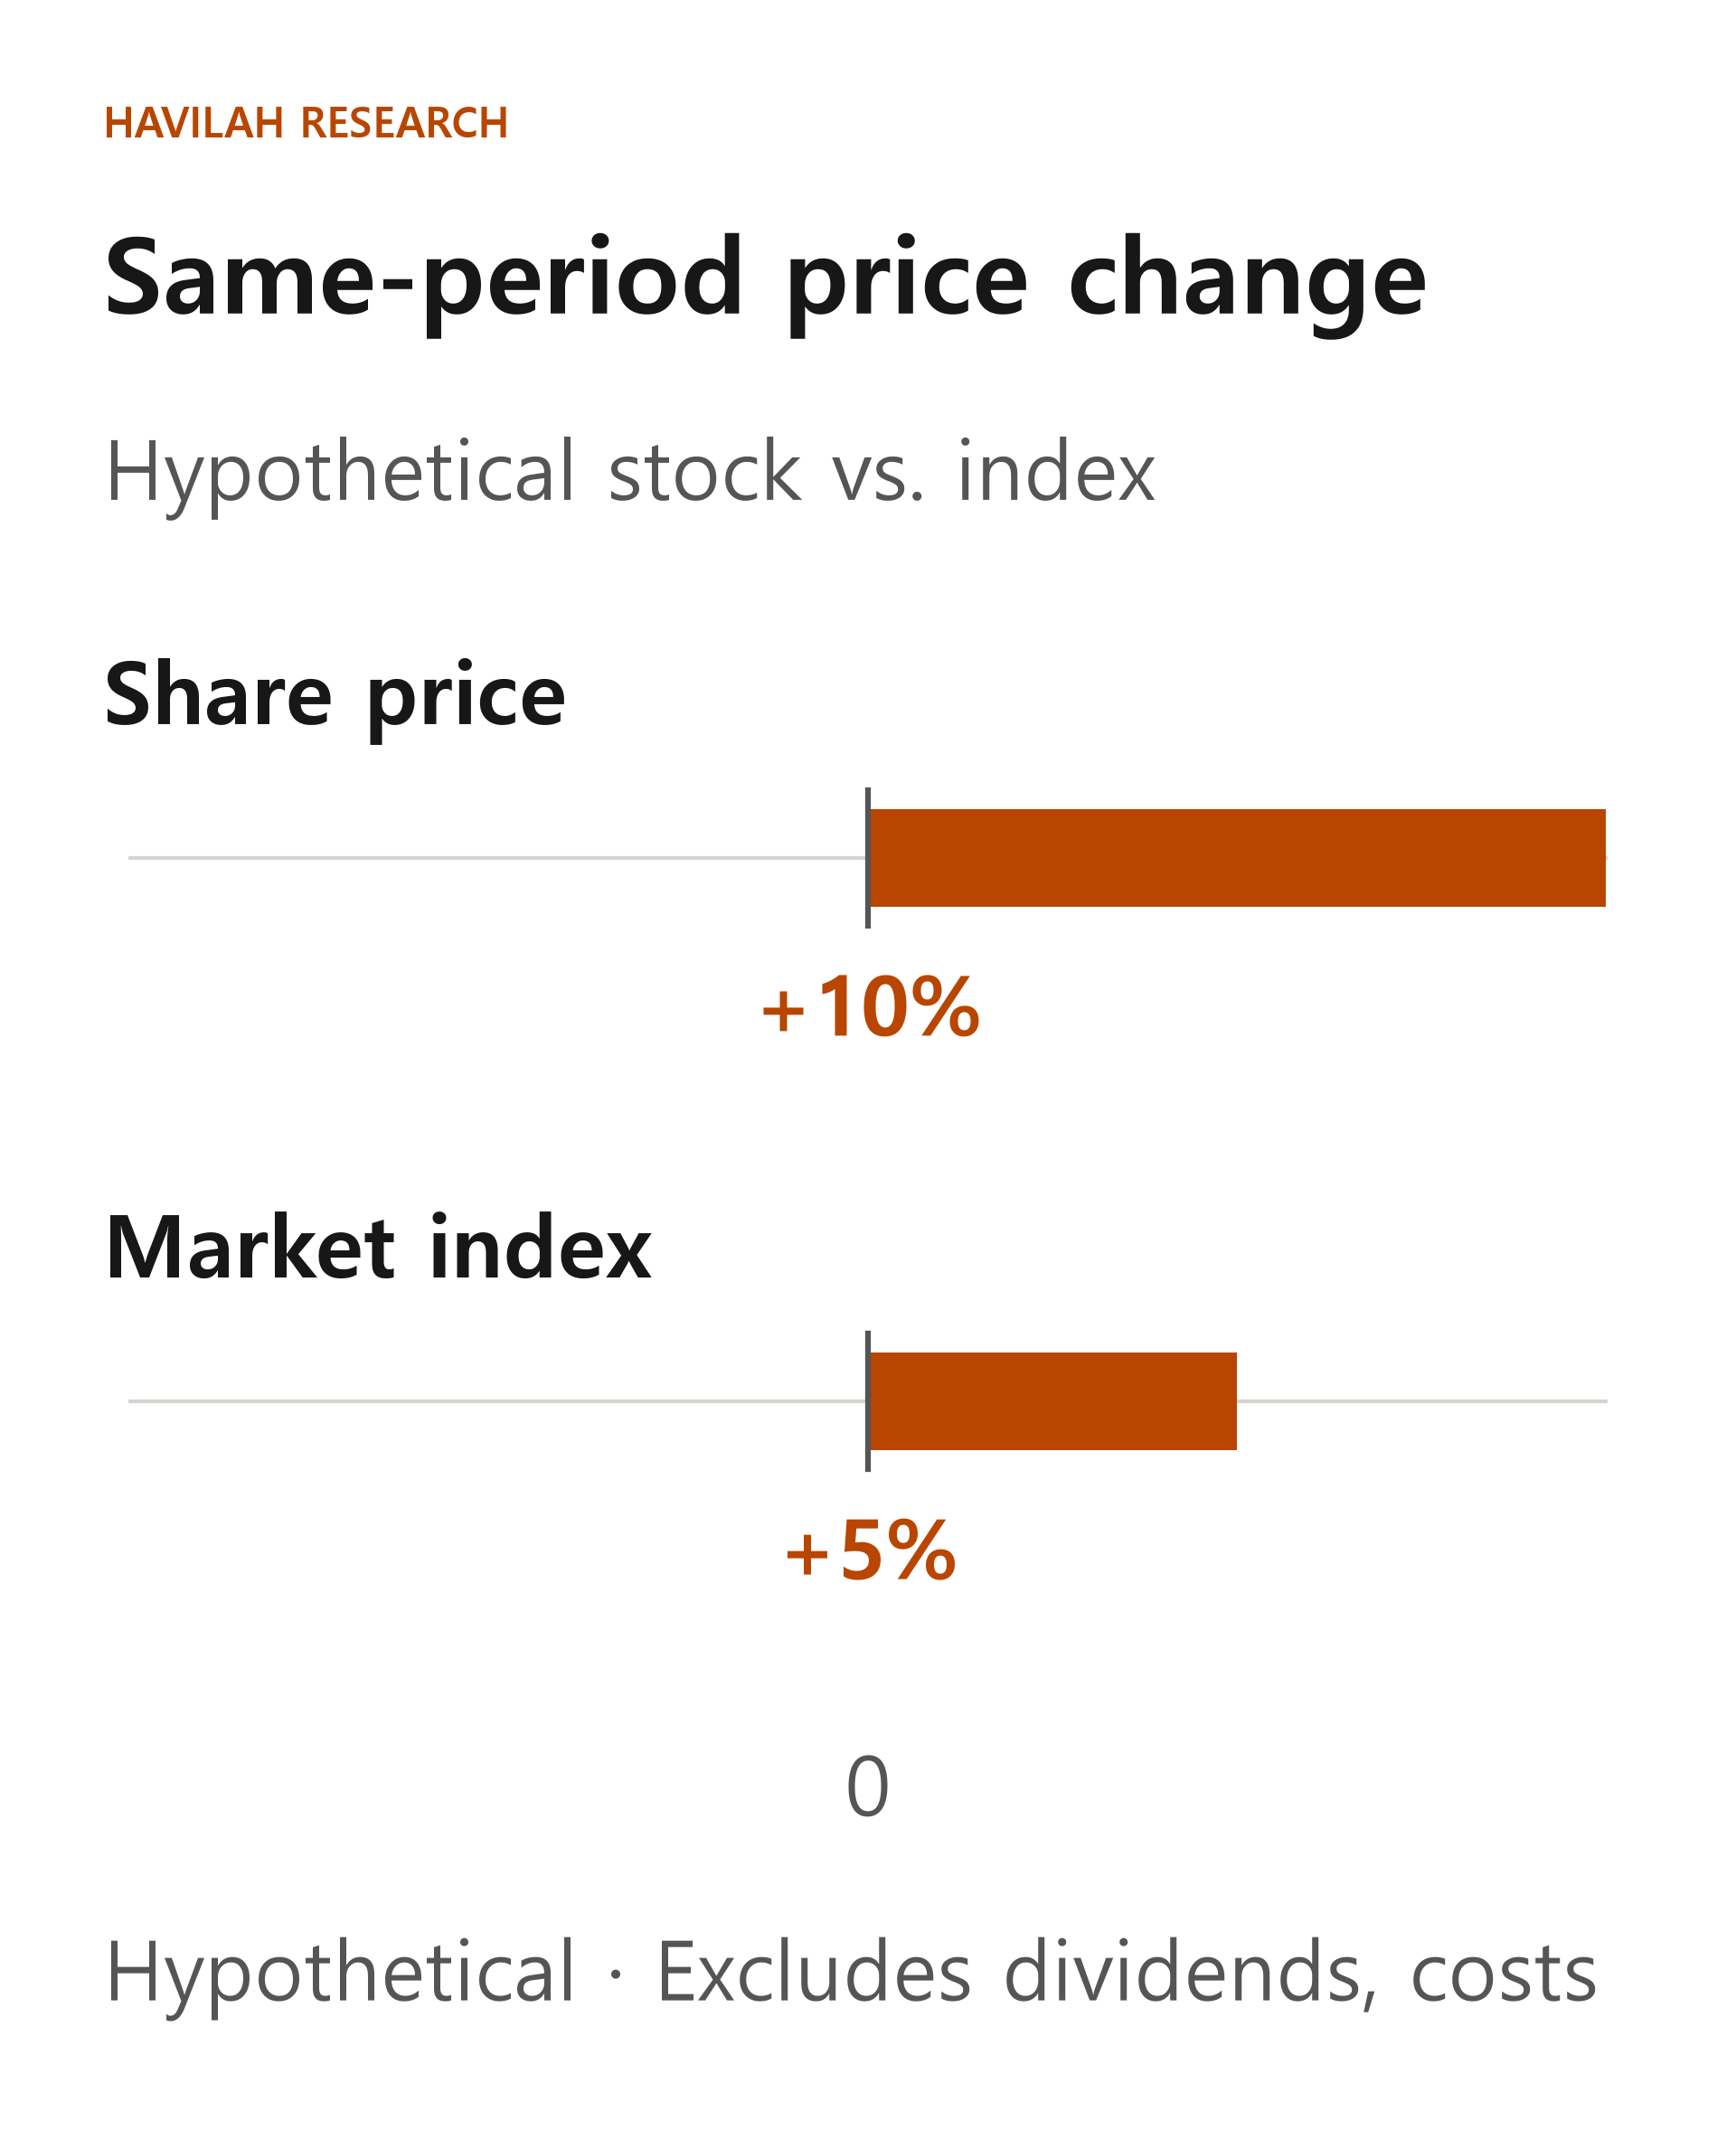
The stock rose more than the index while the index was rising, so it was relatively strong over this period. But that fact alone does not let you conclude that the company will keep producing good results or that its share price will keep rising.
A stock can be relatively strong even when it loses money
In another hypothetical case, suppose a stock falls from $100 to $90 and an index falls from 100 points to 80 points. The stock's price return is −10%, and the index's change is −20%.
The stock fell 10 percentage points less than the market, so you can say it was relatively strong. But an investor holding the stock still has a 10% price loss. Losing less than the market is different from actually making money.
Conversely, if a stock rose a little while the market fell, it went up in absolute terms and was also relatively strong. What matters is looking at both numbers.
How is relative strength on a chart calculated?
Some charts show, as a separate line, the stock price divided by the price or index level of a benchmark. When this ratio rises, the stock performed better than the benchmark over that stretch. When the ratio falls, the stock lagged behind it.
In the first example, when the stock price and the index were both 100, the ratio was 100 ÷ 100 = 1. Later it was 110 ÷ 105 = about 1.0476. Compared with the starting ratio, that is a rise of about 4.76%.
This 4.76% is calculated differently from the 5 percentage-point difference in returns worked out earlier. The difference in returns is 10% minus 5%. The change in the ratio is calculated as 1.10 ÷ 1.05 − 1. Do not treat the two as the same number.
A relative strength comparison and the RSI (Relative Strength Index) also have similar names, but they are different. The relative strength comparison described here divides a stock by a separate benchmark. The RSI is an indicator that uses one stock's own recent price rises and falls. Do not assume they are the same line just because of their names.
What should you compare against?
Choose the benchmark to fit your question. If you compare a U.S. large-cap stock with a broad U.S. large-cap index, you can see how differently it moved from the market. If you compare it with companies in the same industry or with an industry index, you can also examine differences within that sector.
No single index represents every market. For example, if you compare a small company based outside the United States with a U.S. large-cap index, differences in region and company size get mixed in with changes in the company itself. Comparing the same period against a different benchmark can also lead to a different conclusion.
You also need to match the start and end dates, the currency and whether dividends are included. A line that compares only share prices can differ from actual investment performance with dividends received. And because you cannot invest in an index directly, the product you actually invest in can have fees and a gap between its results and the index it tracks. Once exchange rates and taxes are taken into account, the result in your home currency can also differ.
In practice, use it to narrow down candidates
Compare a stock you are interested in with a suitable market index and, if possible, an industry index, over the same period and in the same currency. You can look at when the gap began to widen and whether there was an event worth checking, such as an earnings release or a change in the industry.
If you find a relatively strong stock, the next question is "Why was it strong?" The company's results and business may have improved, or investors' expectations may have risen ahead of them. Being relatively strong does not by itself mean the company is undervalued.
A one-month comparison can give a different result from a one-year comparison, and there is no guarantee that a trend that was strong in the past will continue next month. Use the comparison as a starting point for finding investment ideas, and judge it together with your analysis of the company, the price, the risks and your investment time frame.