
A stock's volume has tripled compared with usual. Does that mean someone is quietly buying up the shares? You can tell that a lot of trading took place, but that number alone cannot tell you who bought or why.
Volume is the number of shares traded over a given period. If one person buys 100 shares and another person sells 100 shares, the volume is 100 shares. You do not count the purchase and the sale separately and add them up to 200 shares. For a trade to happen, there has to be both a buyer and a seller.
Compare it with what is normal
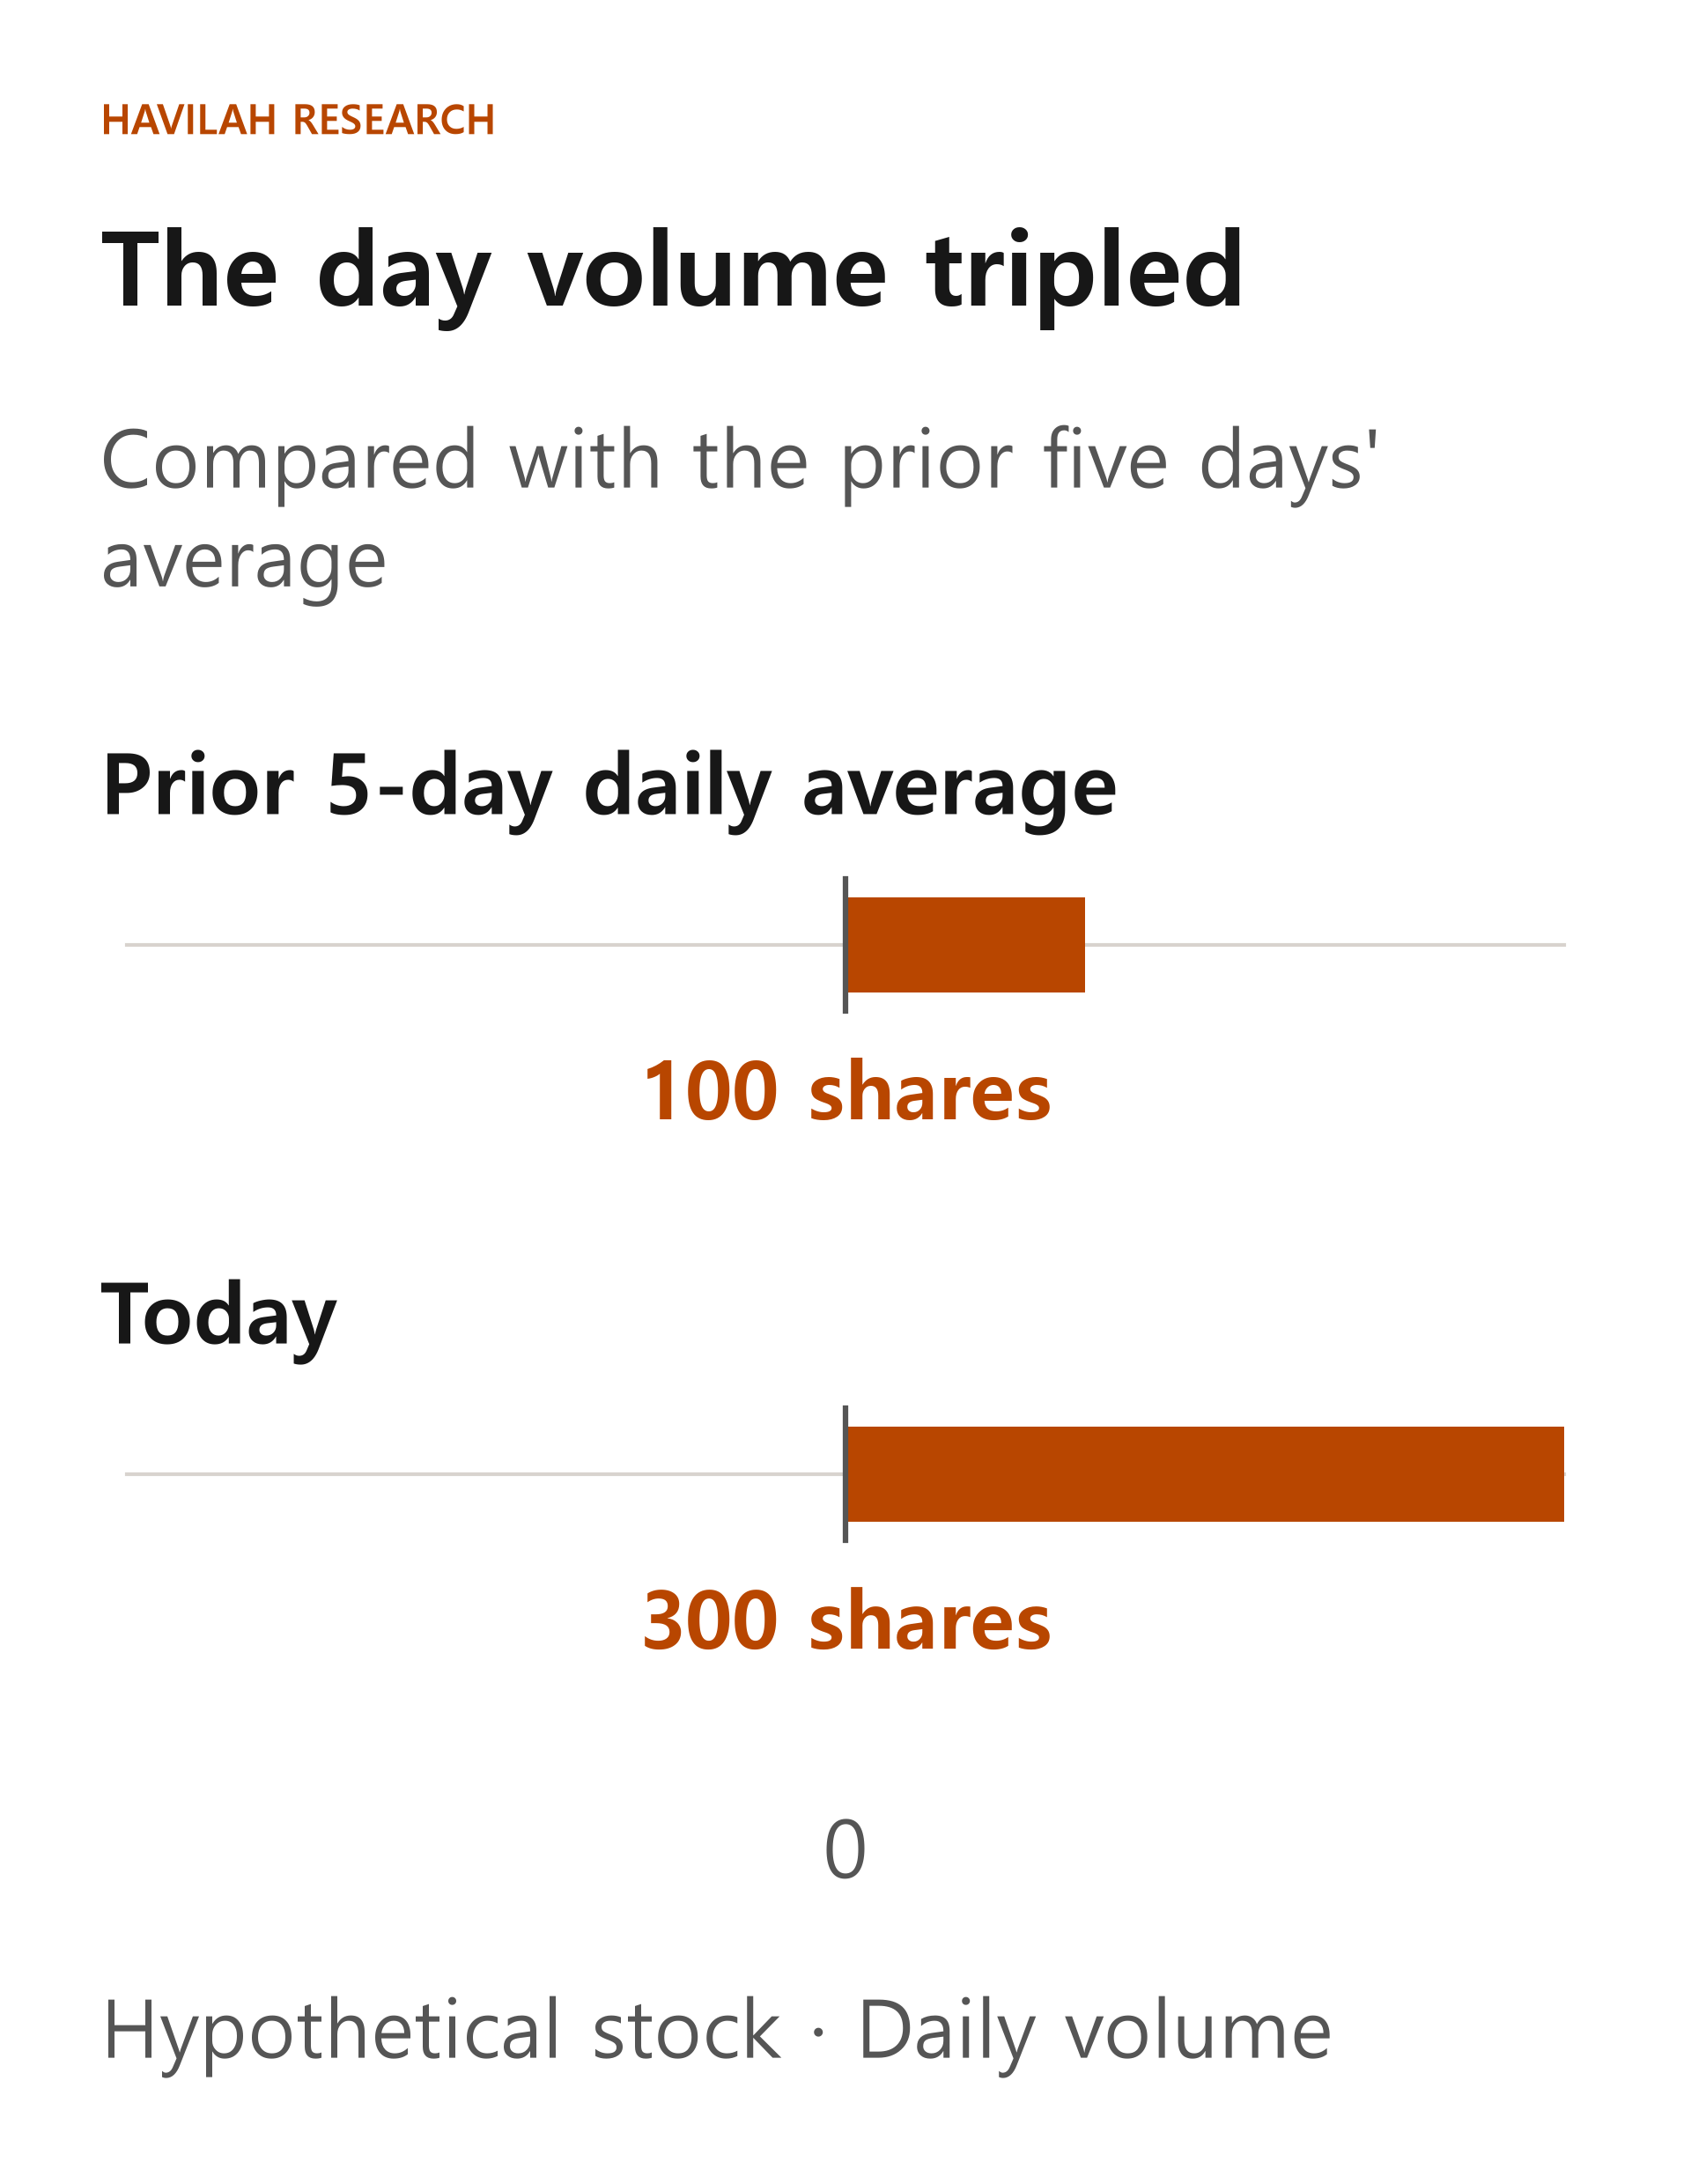
Suppose a hypothetical stock traded an average of 100 shares a day over the previous five trading days. Today's volume is 300 shares. Against the past average, which excludes today, 300 ÷ 100 = 3, so today's volume is three times the average. The increase is 200 shares, or 200% more than the average.
When you compare, make sure the period and the basis match. If you compare the volume so far on an afternoon before the market has closed with the average for full past days, you leave out the trading time that is still to come. Whether extended-hours trading is included can also differ from one screen to another.
Volume tripling means the number of shares traded has increased. It does not tell you how many people took part, or how much a particular investor bought on a net basis. If the same shares are traded several times in one day, each trade can be counted in the volume.
Volume and trading value are different
Volume is a number of shares; trading value is the total amount of money traded, found by multiplying the shares in each trade by the price at which they were actually filled and adding the results. Below is a simple hypothetical example that leaves out commissions.
| Trade | Number of shares | Fill price per share | Trade amount |
|---|---|---|---|
| First | 100 shares | $10 | $1,000 |
| Second | 200 shares | $12 | $2,400 |
| Total | 300 shares | Price differs by trade | $3,400 |
Not all 300 shares of volume traded at $12. Multiplying the last price of $12 by 300 shares gives $3,600, which differs from the actual trading value of $3,400 in the example. A figure obtained by multiplying volume by the last price can only be a rough estimate, not the exact trading value.
Dividing the trading value of $3,400 by the volume of 300 shares gives an average fill price of about $11.33 per share in this example. It is an average in which each price counts in proportion to the number of shares traded at it. When you compare trading value and average prices on a real screen, also check that the figures cover the same exchanges and the same time range.
What can you learn by comparing volume with the float?
Not all of the shares a company has issued and that are still outstanding trade freely every day. The portion of those shares that ordinary investors can trade is called the float. Data providers can differ in which holdings they exclude and when they update the number, so check how it is defined.
If a hypothetical stock has a float of 1,000 shares and daily volume of 300 shares, then 300 ÷ 1,000 × 100 = 30%. This is the ratio of volume to the float. It does not mean that different shareholders sold 30% of the float. Because the same shares can be traded several times, this ratio can even exceed 100%.
For a stock with a small float, a limited number of buy and sell orders can move the price a lot. Even when volume is higher than usual, whether you can trade the quantity you want at the price you want is a separate question. Also look at the bid-ask spread and the quantity of shares in the orders currently waiting to be filled.
Why volume alone does not mean accumulation
Accumulation means someone buying shares to increase their holdings. But every share of volume has both a buyer and a seller, and a single bar on a chart cannot tell you who was on which side. Right after news, investors with different views may have been trading actively at the same time. Many other things, such as a change in the stocks that make up an index or large block trades, can also play a part.
Some indicators look at price and volume together. For example, one accumulation/distribution indicator uses volume together with where the day's close sits between that day's high and low. But this indicator does not directly count changes in what real accounts hold. Even on a day when the price falls sharply from the previous day, the indicator can rise if the close is above the middle of that day's range.
If volume rose and the price went up, the accurate thing to record is that "the price rose while a large number of shares changed hands." A conclusion that a particular institution has been accumulating shares should wait until you have checked separate ownership filings or other evidence. Filings, too, have reporting dates and delays, so they do not show everything that traded on a given day.
How to look at volume in real investing
If volume in a stock you are interested in has risen, first compare it with the past average over the same time range, and check whether the price rose or fell. Also look at information released around the same time, such as an earnings release or a company filing. Then check the trading value, the float, the bid-ask spread and the size of your own order together.
Rather than buying or selling just because volume is high, it is better to also look at changes in the company and at the loss you can bear. High volume does not guarantee a future rise or fall either.
In the next lesson, we will look at how to compare a single stock's movement with the market as a whole.