
Suppose a share price has fallen back every time it came near $100, and then one day it climbs above $101. Will it keep rising now? It might, but it could also drop back below $100. A place where the price stopped in the past is a clue for investors to examine, not a line that settles the future price.
Price zones that people watch
If a share price has fallen and then stopped and turned up several times around a similar price, that area is called a support zone. Conversely, if it has risen and then stopped and turned down several times around a similar price, that area is called a resistance zone.
For example, suppose a stock rebounded several times around $95 and turned down several times around $109. An investor might watch the area near $95 as support and the area near $109 as resistance. These terms summarize past movements. They do not mean the price will always rise at $95 or will always fall at $109.
In reality, prices do not stop at exactly the same number every time. You can look at a range instead, such as $94 to $96. How wide to make the range depends on the period you are analyzing and on how volatile the stock is, so there is no single right answer.
Why does the price stop there?
Prices move as orders from people who want to buy meet orders from people who want to sell. When the price has fallen and more people want to buy, or fewer want to sell, the fall can stop. Conversely, when the price has risen and sell orders increase, or interest in buying weakens, the rise can stop.
Some people may want to sell near the price at which they bought earlier, and others may want to buy at a price they missed before. But a chart alone cannot reveal every investor's thinking or orders. Even if a lot of trading took place in a particular price zone, you cannot know who still holds those shares or whether they will definitely sell in the future.
Do not assume that the many shares traded there in the past will all be offered for sale again next time. The holders may already have changed, and if the company's results or the news change, people's judgments can change too. A price zone only tells you where to take another look when the price gets there.
A price can break through and then fall back
Below are hypothetical closing prices made up for illustration. The support zone is set at $94 to $96 and the resistance zone at $108 to $110. The price moved to $95, $110, $95, $109, $105, $112 and $107, in that order.
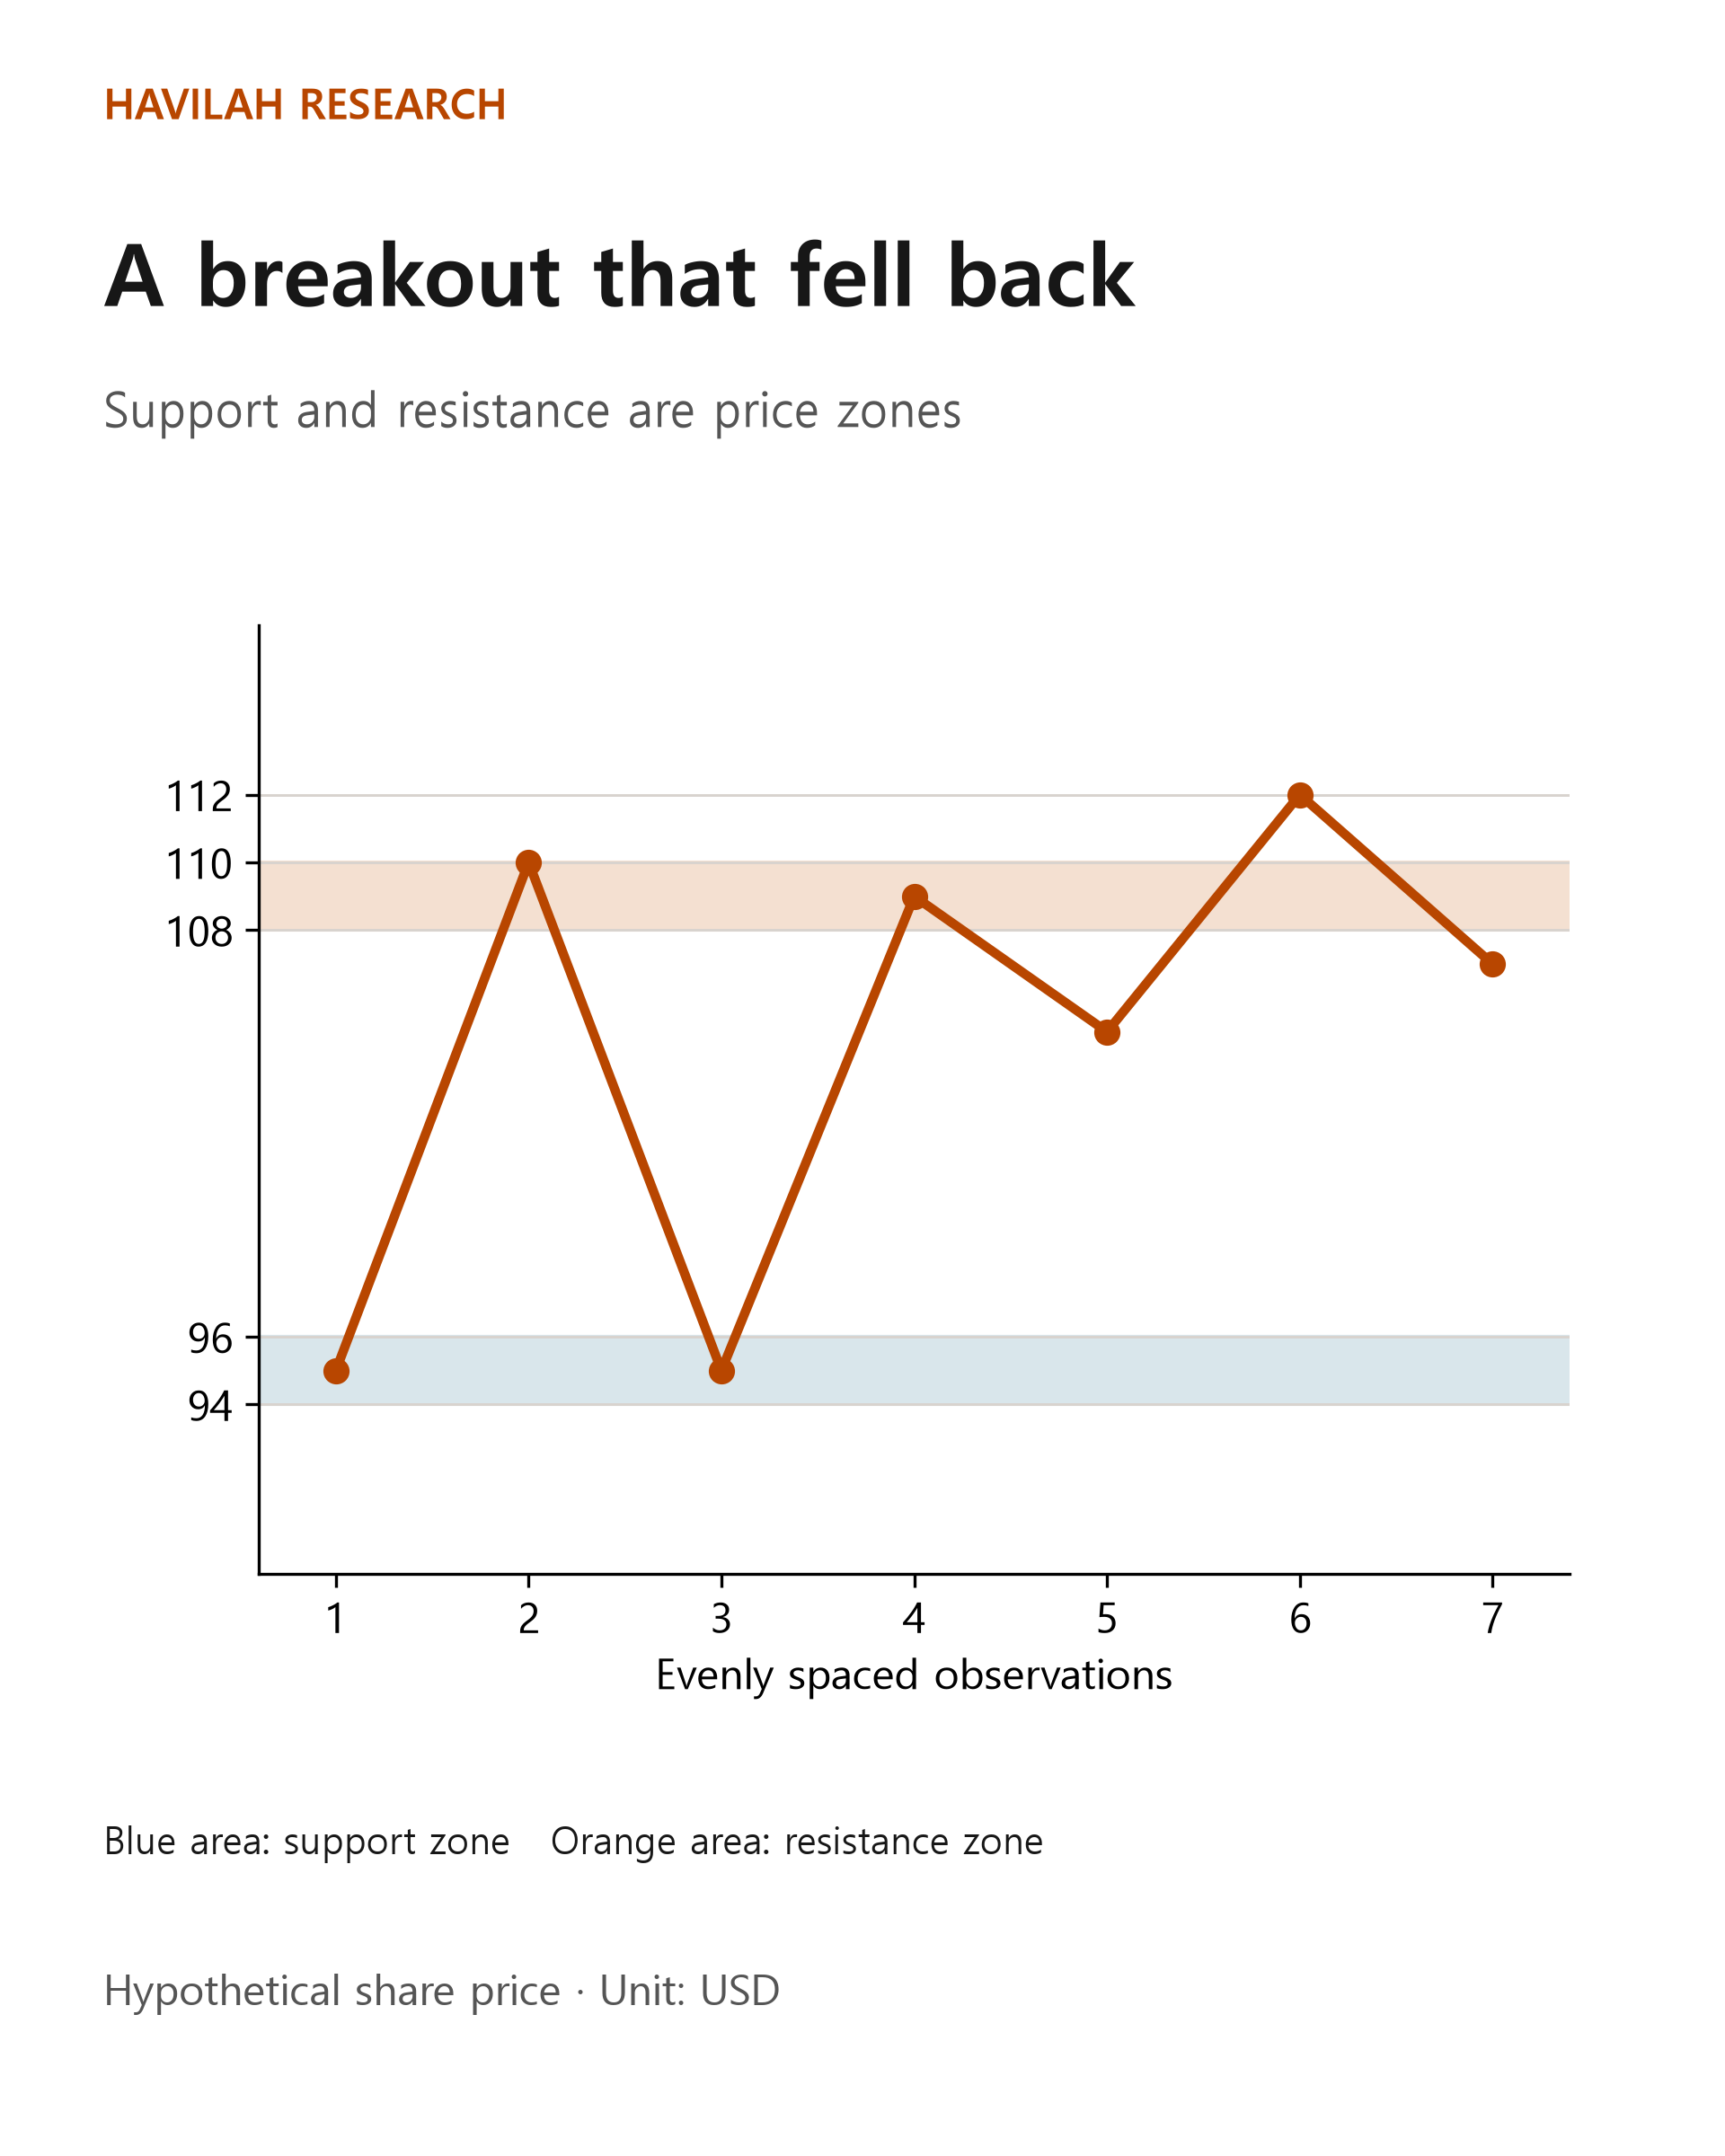
At the sixth observation, the price reaches $112, above $110, the top of the resistance zone. You can call this a breakout. But at the seventh observation, the price is back below the resistance zone at $107. This is a case where the earlier breakout did not last. A different outcome, in which the price keeps rising after $112, is also possible.
If a hypothetical investor bought one share at $112 and sold it at $107, the loss would be $5 per share. Measured against the purchase price of $112, that is a loss of 5 ÷ 112 × 100 = about 4.46%. Trading commissions, taxes and exchange rates are left out of this calculation, so you cannot treat it as your actual gain or loss in your home currency.
When the price comes back to a level it broke through
Sometimes, after the price rises above a resistance zone, it comes back down to around that zone. Investors call this move a retest. If the price rebounds when it comes back down, you can interpret the zone that used to look like resistance as having acted like support afterward.
But a retest does not always happen. And after a retest, the price may drop straight below the zone. A price that has fallen below support sometimes fails to rise past that area later, so the area looks like resistance, but there is no rule that the roles switch automatically.
Some people also check volume. Volume is the number of shares traded over a given period. If volume was higher than usual, it means more shares changed hands. Volume alone cannot tell you whether more people took part in the trading. And even with high volume, a breakout can fail; volume alone cannot settle the next direction.
How can you use this in real investing?
First, decide whether the chart you are looking at uses daily or weekly candles, and mark the areas where the price has reacted several times in the past. Check that you are not grouping a few prices that are far apart however you like, creating a range that is too wide. If the observation period is short, as with the real data on three stocks in Lesson 154, it is hard to claim long-lasting support or resistance from that table alone.
Before you invest, think about both what happens if the price moves as you expect and what happens if it moves the other way. Decide in advance at what price you will recheck your judgment, how much you will invest and how you will respond if the loss grows. If the price jumps or drops sharply, you may not be able to trade at the price you want.
Also, a price zone on a chart and the value of a company are different questions. A company's results do not improve just because its share price has reached a support zone. You also need to look at the company's business and finances, and at the expectations built into the price.
Points to remember
Support is a price zone where falls stopped in the past, and resistance is a price zone where rises stopped. Neither guarantees the future, and a price that has broken through a zone can come back. Use past price zones as a reference, but also think about how much you invest and how you will respond if things do not go as planned.