
A stock that closed at $100 yesterday starts trading at $90 today. What happened overnight? When a company reports earnings or important news comes out, investors' views can change, and the opening price of the next regular session can be very different from the day before.
A large difference like this between one day's close and the next day's open is commonly called a gap. The close is the price at the end of the day's regular trading, and the open is the price at the start of the next regular trading session. If the price opens well above the previous close, it is a gap up; if it opens well below, it is a gap down.
Compare the close and the open first
Suppose a hypothetical stock closed at $100 in the previous day's regular session and opened at $90 the next day. The price difference is $10. Measured from the previous close of $100, that is a fall of 10 ÷ 100 × 100 = 10%.
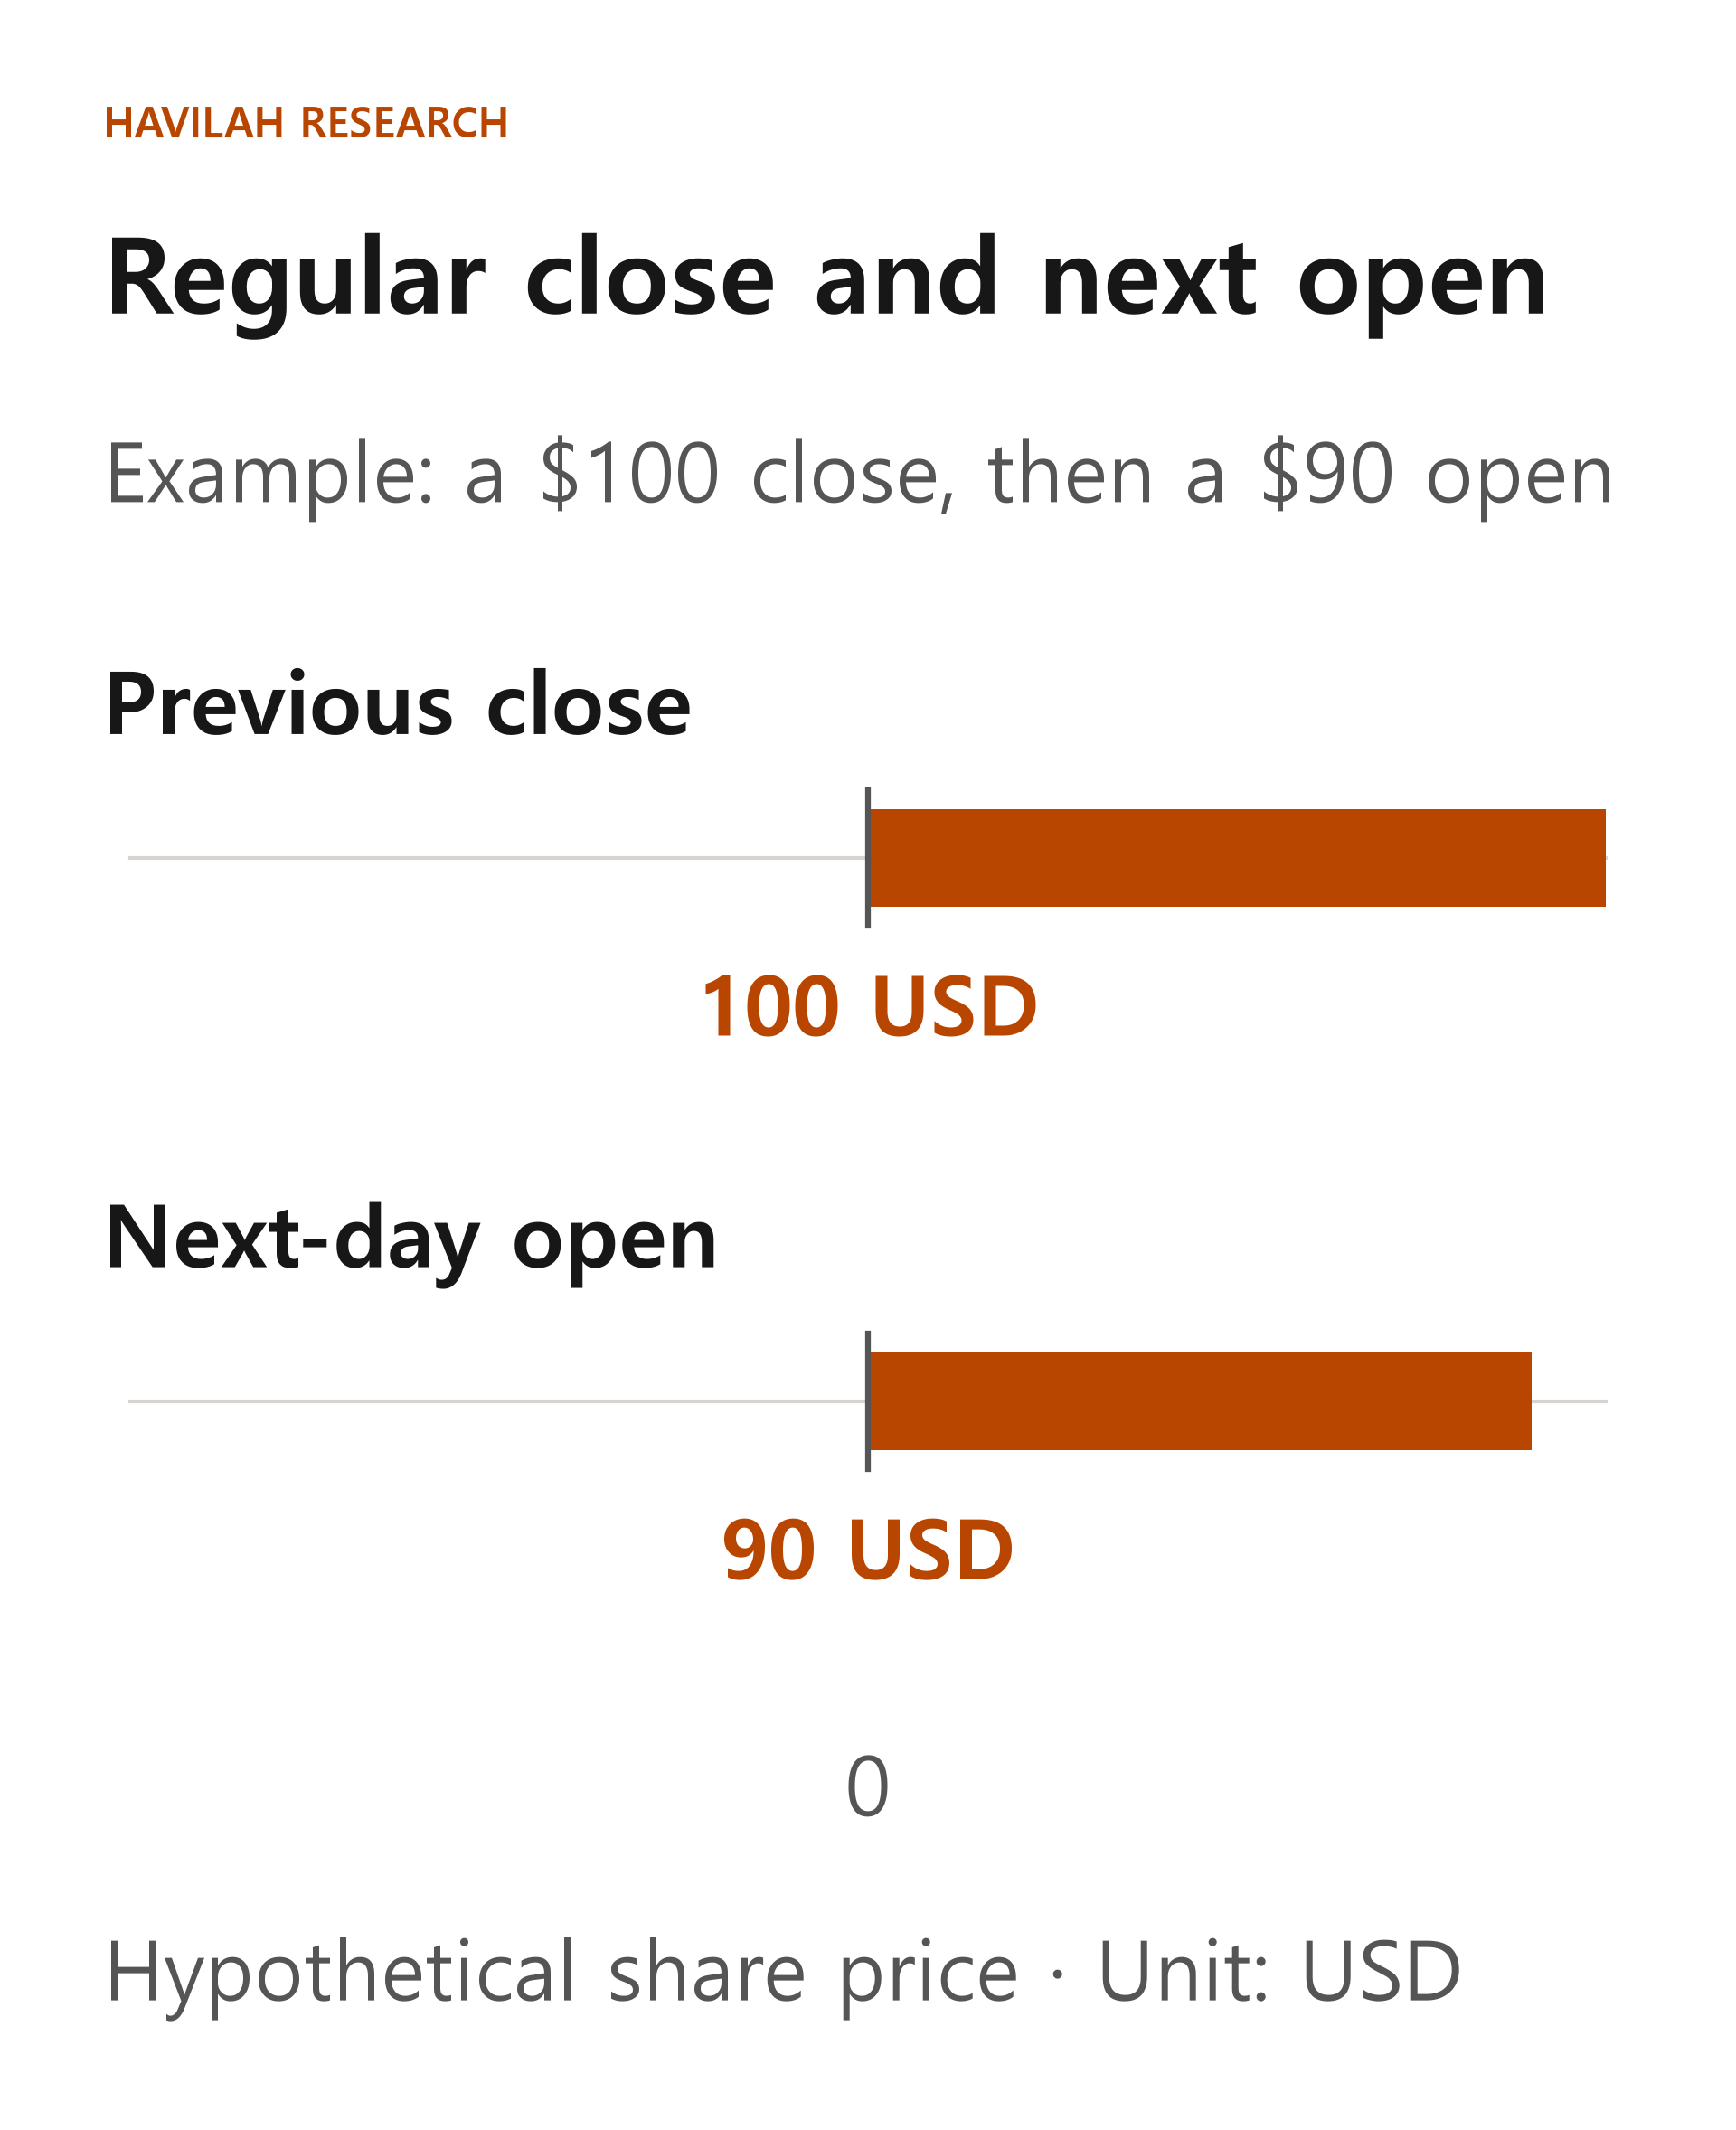
If the previous day's trading range was $95 to $103 and the next day's regular-session range was $88 to $94, there is also an empty stretch between the two regular-session price ranges. However, if the chart shows only regular sessions, you cannot tell whether there was extended-hours trading in between. An empty stretch on a regular-session chart does not mean there was no trading at all overnight.
When you look at a chart, first check whether the prices being compared are the regular-session close and open, or whether they include extended-hours prices. Even the numbers for the same day can look different on screen depending on the basis.
Can a stock fall after good results?
Yes. Investors trade a stock on their expectations for revenue, profit and future growth even before results are released. Even if actual results are better than the year before, the share price can fall if they miss existing expectations or if the company lowers its outlook. Conversely, even a company that made a loss can see its price rise if the results are less bad than expected or its outlook improves.
What matters is not to look at a single reported number, but to examine what was already expected and what has changed. Check not only revenue and profit but also the guidance the company gives for the future, its costs and its cash flow. However, investors' expectations differ, and other news can come out at the same time, so you cannot pin the cause of a price move on earnings alone.
Let's look at a real past example. Microsoft reported quarterly results on October 30, 2024, and announced that it would hold its earnings conference call after the U.S. regular session closed that day. In the historical daily price data, the close on October 30 was $432.53, and the open on the next trading day, October 31, was $415.36. The difference was $17.17, a fall of about 3.97% from the previous close.
This is a historical observation comparing two prices. The earnings release and the price change happened around the same time, but you cannot conclude that the earnings were the only cause of the fall.
Trading can continue after the market closes
U.S. stocks can sometimes be traded in extended-hours sessions before and after the regular session. If a company reports results after the market closes, the price can move before the regular session opens. But there is no guarantee that the extended-hours price will match the next regular session's open.
During extended hours, there are fewer people to trade with, so it can be hard to trade the quantity you want, and the gap between the price buyers will pay and the price sellers will accept can widen. This gap is called the bid-ask spread. Trading hours and order types vary by broker and product, so check your broker's information before you actually place an order.
Before you buy on a jump or sell on a drop
Prices keep moving after a gap. If a hypothetical stock that opened at $90 closed that day at $92, it rose $2 from the open. Measured from the open of $90, that is a rise of about 2.22%. But compared with the previous close of $100, it is still 8% lower. The same day can be described differently depending on which price you measure from.
If you rush to buy after seeing a sharp jump, you may end up paying a price that has already risen. Even if a price after a sharp fall looks cheap, check whether the change in results or outlook is big enough to change your investment judgment. The price can rise or fall further afterward, and the price does not necessarily return to where it was before the gap.
Recheck your orders and your plan for losses
For example, you may have bought a stock at $100 and planned to sell it at $95, but the next day it may open at $90. Even if a stop-loss order is triggered as set, it may be filled at a price different from the $95 you specified. An order that becomes a limit order once its condition is met (a stop-limit order) guards against a fill at a worse price than the one you set, but if the price moves past that level, the order may not be filled at all. Check with your broker whether it actually supports these orders and what triggers them.
Before an earnings release, check when it will come out, which numbers your investment judgment depends on, and whether you can handle a bigger price move than you expect. Setting a single price in advance does not, by itself, guarantee that your loss will stay at the size you planned.
A gap is a trace of a price change around new information. Look at its causes and at what happens afterward, but also check regular-session versus extended-hours prices, the basis of comparison and the limits on how orders are filled.
In the next lesson, we will look at what it means when volume rises, and whether volume alone can tell you that a stock is being accumulated.