
Even while a share price is rising, it can fall for several days at a time. How can you check whether a drop like this is a movement that has happened before? One way is to draw lines on the chart and look at the range in which the price has been moving. These lines are marks that help your judgment, not promises the share price has to keep.
Connecting the low points gives you a trendline
A trough, as you learned in Lesson 154, is a point where the price fell and then came back up. If the troughs keep getting higher in a rising pattern, you can connect them with a line that slopes upward to the right. This is an uptrend line.
In a falling pattern, on the other hand, you connect the peaks, where the price rebounded and then fell again. If the peaks keep getting lower, the line slopes downward to the right. You need at least two points to draw a line. After that, you can watch how the price moves around the line.
Which points count as peaks and troughs depends on the criteria you use. If you mix small day-to-day fluctuations with large moves that span several weeks, the meaning of the line becomes unclear. It is best to decide first whether you are using daily or weekly candles and which period you will examine.
The area between two lines is called a channel
Below is a hypothetical share price drawn on a linear price scale, where equal dollar differences take up equal vertical distances. Assume the prices observed at equal intervals were $90, $110, $100, $120 and $110, in that order. The first $90 became a trough because the price had come down from $100 before it and then rose again. Assume also that the price later rose again after the fifth point, confirming it as a trough.
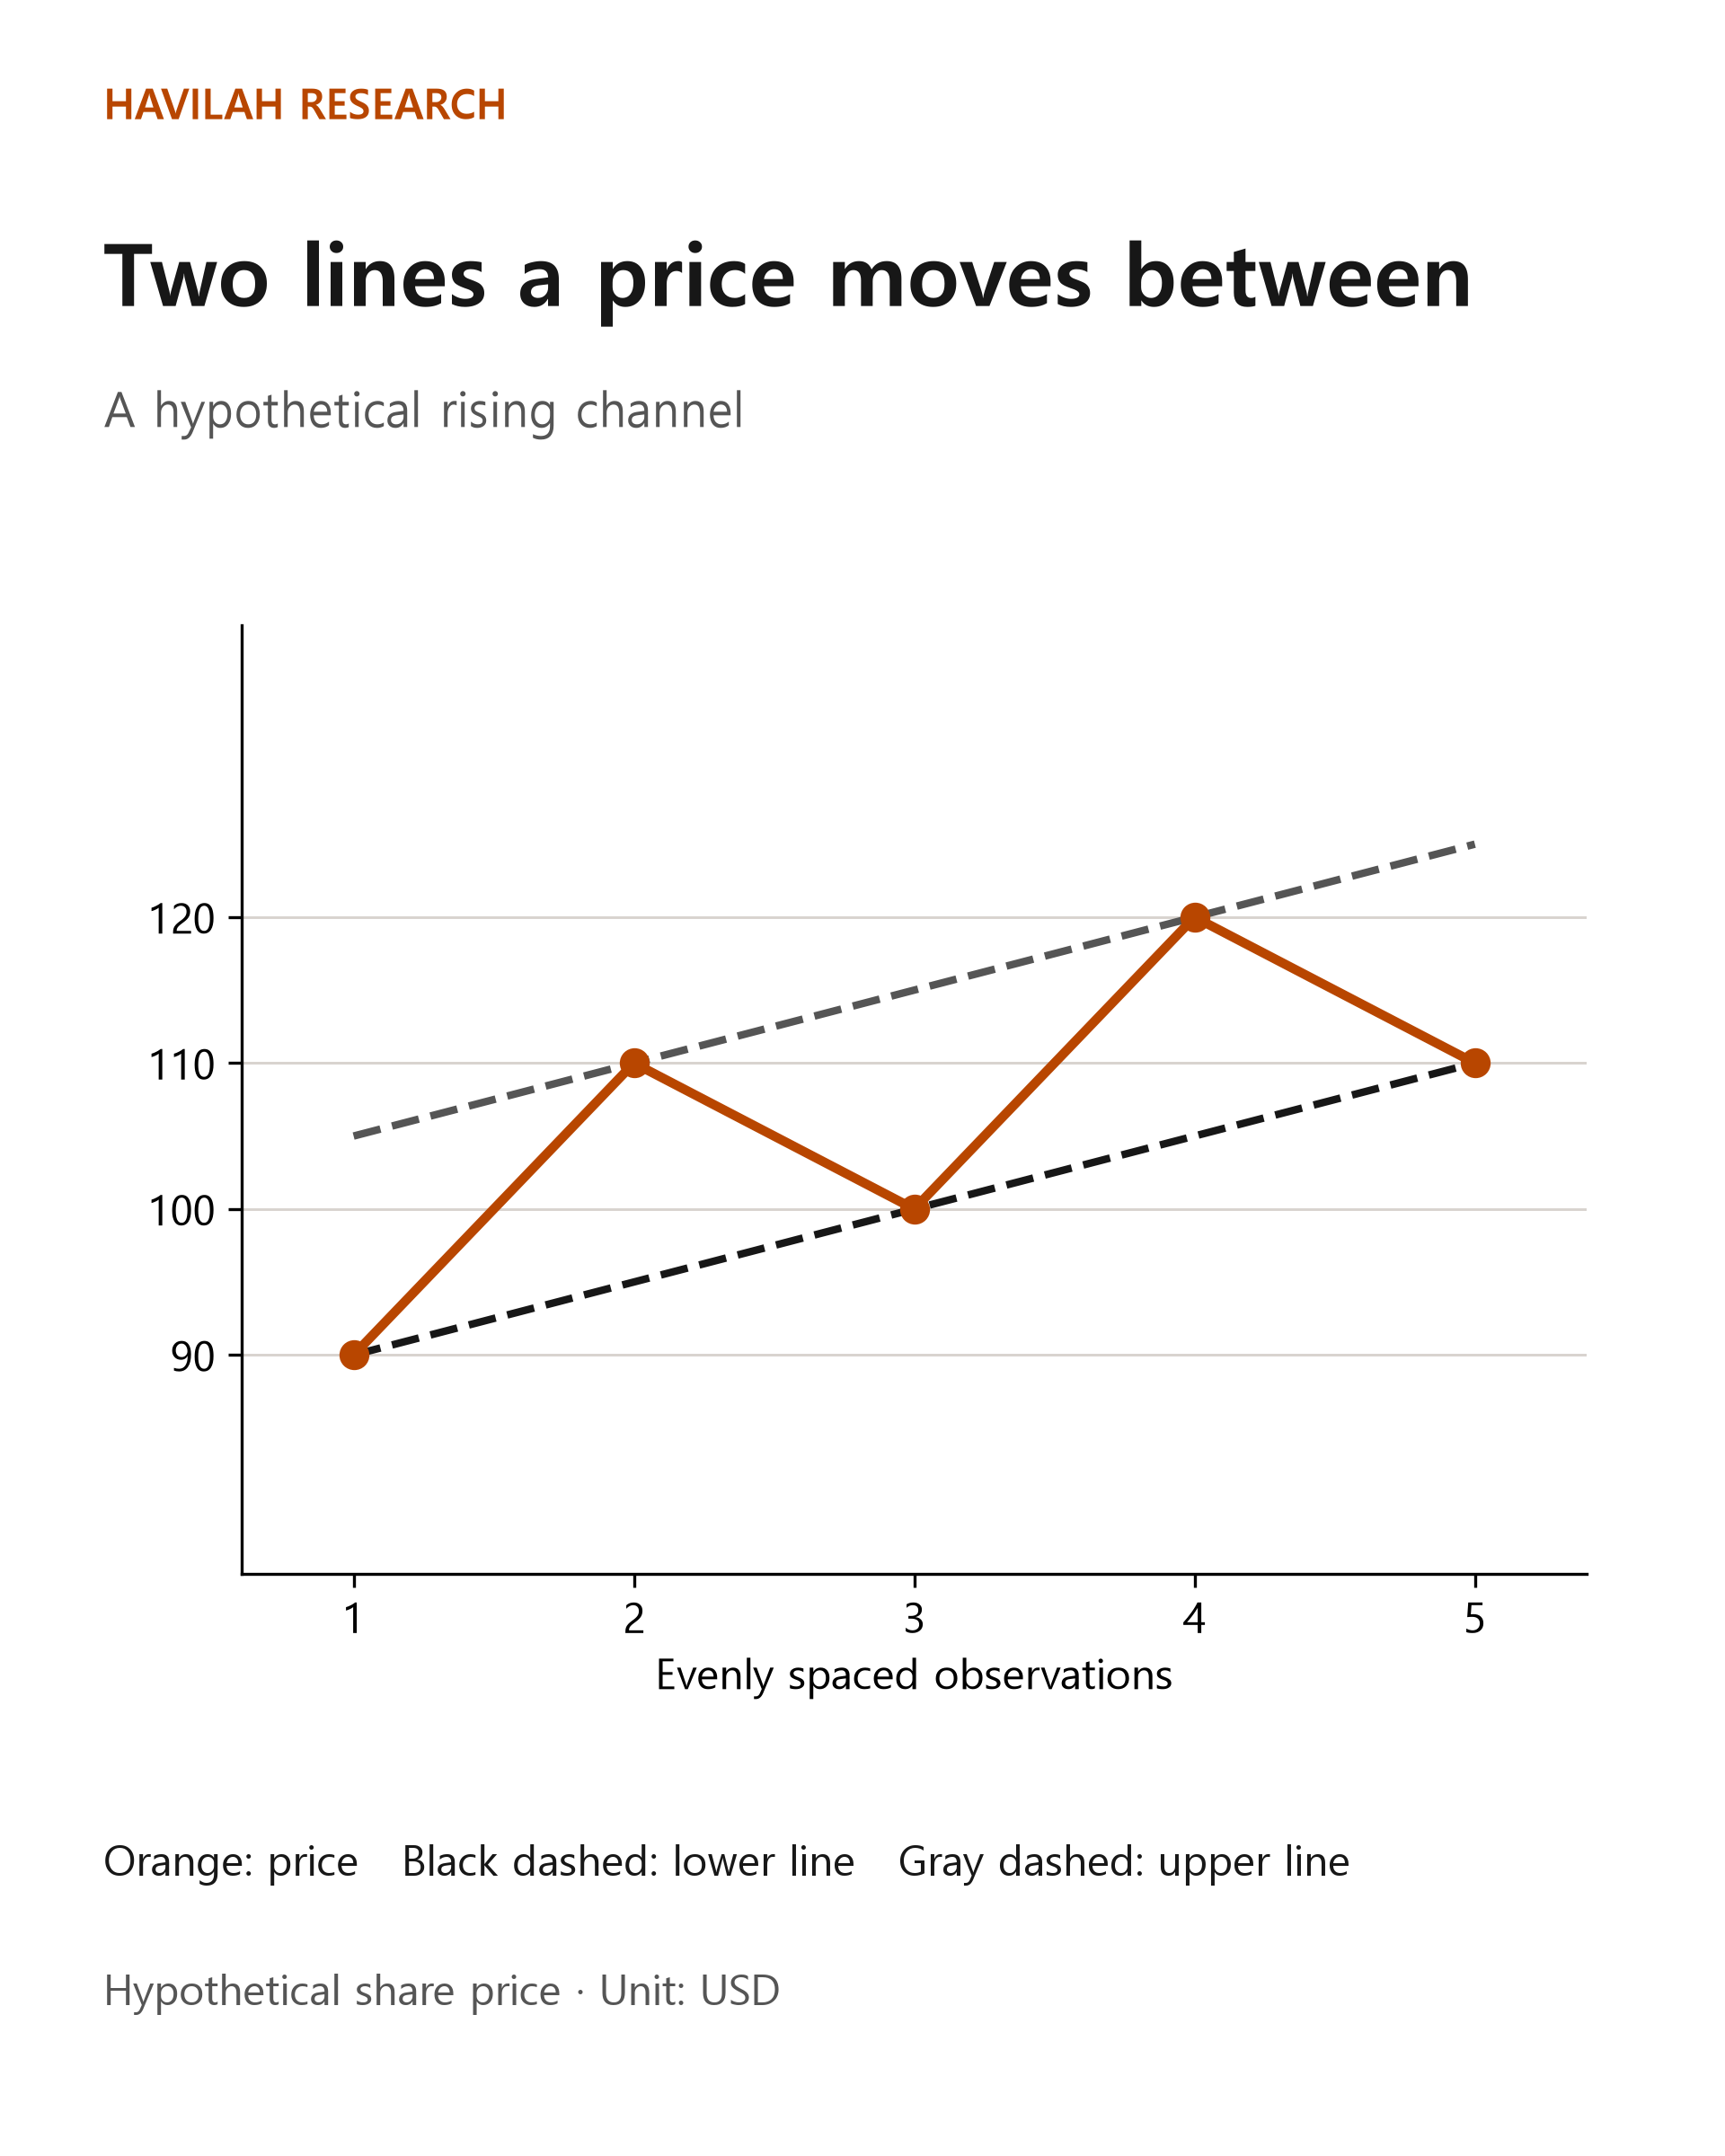
If you connect the first trough at $90 with the trough of $100 at the third point, you can draw a rising lower line. In this example, the price difference between those two points is $10, and they are two steps apart. So the line rises by $5 with each step. At the fifth point, the lower line is at $110.
Now let's draw another line above it with the same slope as the lower line. In the figure, the upper line starts at $105 at the first point. It is $15 above the lower line, and the two lines rise at the same rate. The area between them is called a rising channel. Here, the second price of $110 and the fourth price of $120 touch the upper line.
Real share prices do not move neatly between two lines. In many cases there is no stretch where a line is worth drawing at all. A price touching a line a few times does not mean it will always change direction at that line in the future.
Keep the same criteria when you draw lines
Even on the same chart, the line changes depending on who draws it and which troughs they pick. If you keep redrawing a line to reach a conclusion you like, you end up with a picture fitted to the result rather than an analysis.
Set the period and the price basis at the start. For example, decide whether you will look at weekly or daily candles, and whether you will use the highest and lowest prices at the tips of the wicks or the closing prices. Also remember the difference between linear and log scales from Lesson 153. If you change the scale, a line joining the same two prices can pass through a different price range.
It also helps to record the date you drew a line, along with only the prices you could see at that time. If you use a trough that was confirmed only later as though you had already known about it, your judgment looks easier than it really was. The three-week table for Apple, Microsoft and Coca-Cola in Lesson 154 also shows only each week's highest and lowest prices. From that table alone, you cannot draw a trendline with a confirmed time order. You need to check the daily raw data and a longer period first.
How should you interpret a move outside the line?
In the hypothetical example above, if you extend the lower line at the same rate to the sixth point, it reaches $115. If the share price at that point is $112, it is $3 below the line. Dividing $3 by the line's price of $115 gives about 2.61%. This is only the gap between the line and the price, not an investment loss rate. Your actual loss rate depends on the prices at which you bought and sold, your costs and other factors.
You can treat a move below the lower line as a warning that the trend may be weakening. But it does not mean the trend has immediately turned into a downtrend. The price may dip below the line briefly and then come back up. Or it may not come back and fall further instead.
If you are planning a trade, you can decide in advance what you will check and how you will respond if the price breaks the line. For example, you might check whether the price stays below the line on a closing basis, whether a new trough has formed, and whether the company's results or your reasons for investing have changed. If the price moves quickly or major news comes out before the market opens, you may not be able to trade at the price you had in mind. Even if you use a stop-loss order, there is no guarantee that it will be filled at that price.
Points to remember
An uptrend line connects rising troughs, and a downtrend line connects falling peaks; both are tools for examining how a price is moving. You can treat movement between two parallel lines as a channel, but there is no guarantee that the share price will stay inside it.
Decide the basis for your lines and the observation period first, and plan how you will respond if the price moves outside a line. In the next lesson, we will look at how to understand price zones where prices often stop or change direction.