
If a share price rose yesterday, is it in an uptrend? The fact that it rose for one day is not enough to tell. A stock that had been falling steadily may simply have bounced for a moment. Looking at a trend means looking at the pattern of a price's rises and falls, rather than the direction of a single day.
Share prices move like a staircase
Share prices do not move in the same direction every day. It is common for a price to rise, pull back for a while and then rise again. A point where the price climbed above the prices around it and then came back down is called a peak, and a point where it fell below the prices around it and then went back up is called a trough.
For example, suppose a hypothetical share price first fell from $100 to $90, then rose to $110 and came back down to $100. The figure starts from the first trough at $90. After that, the price rose to $120, fell back to $110 and then rose again to $130.
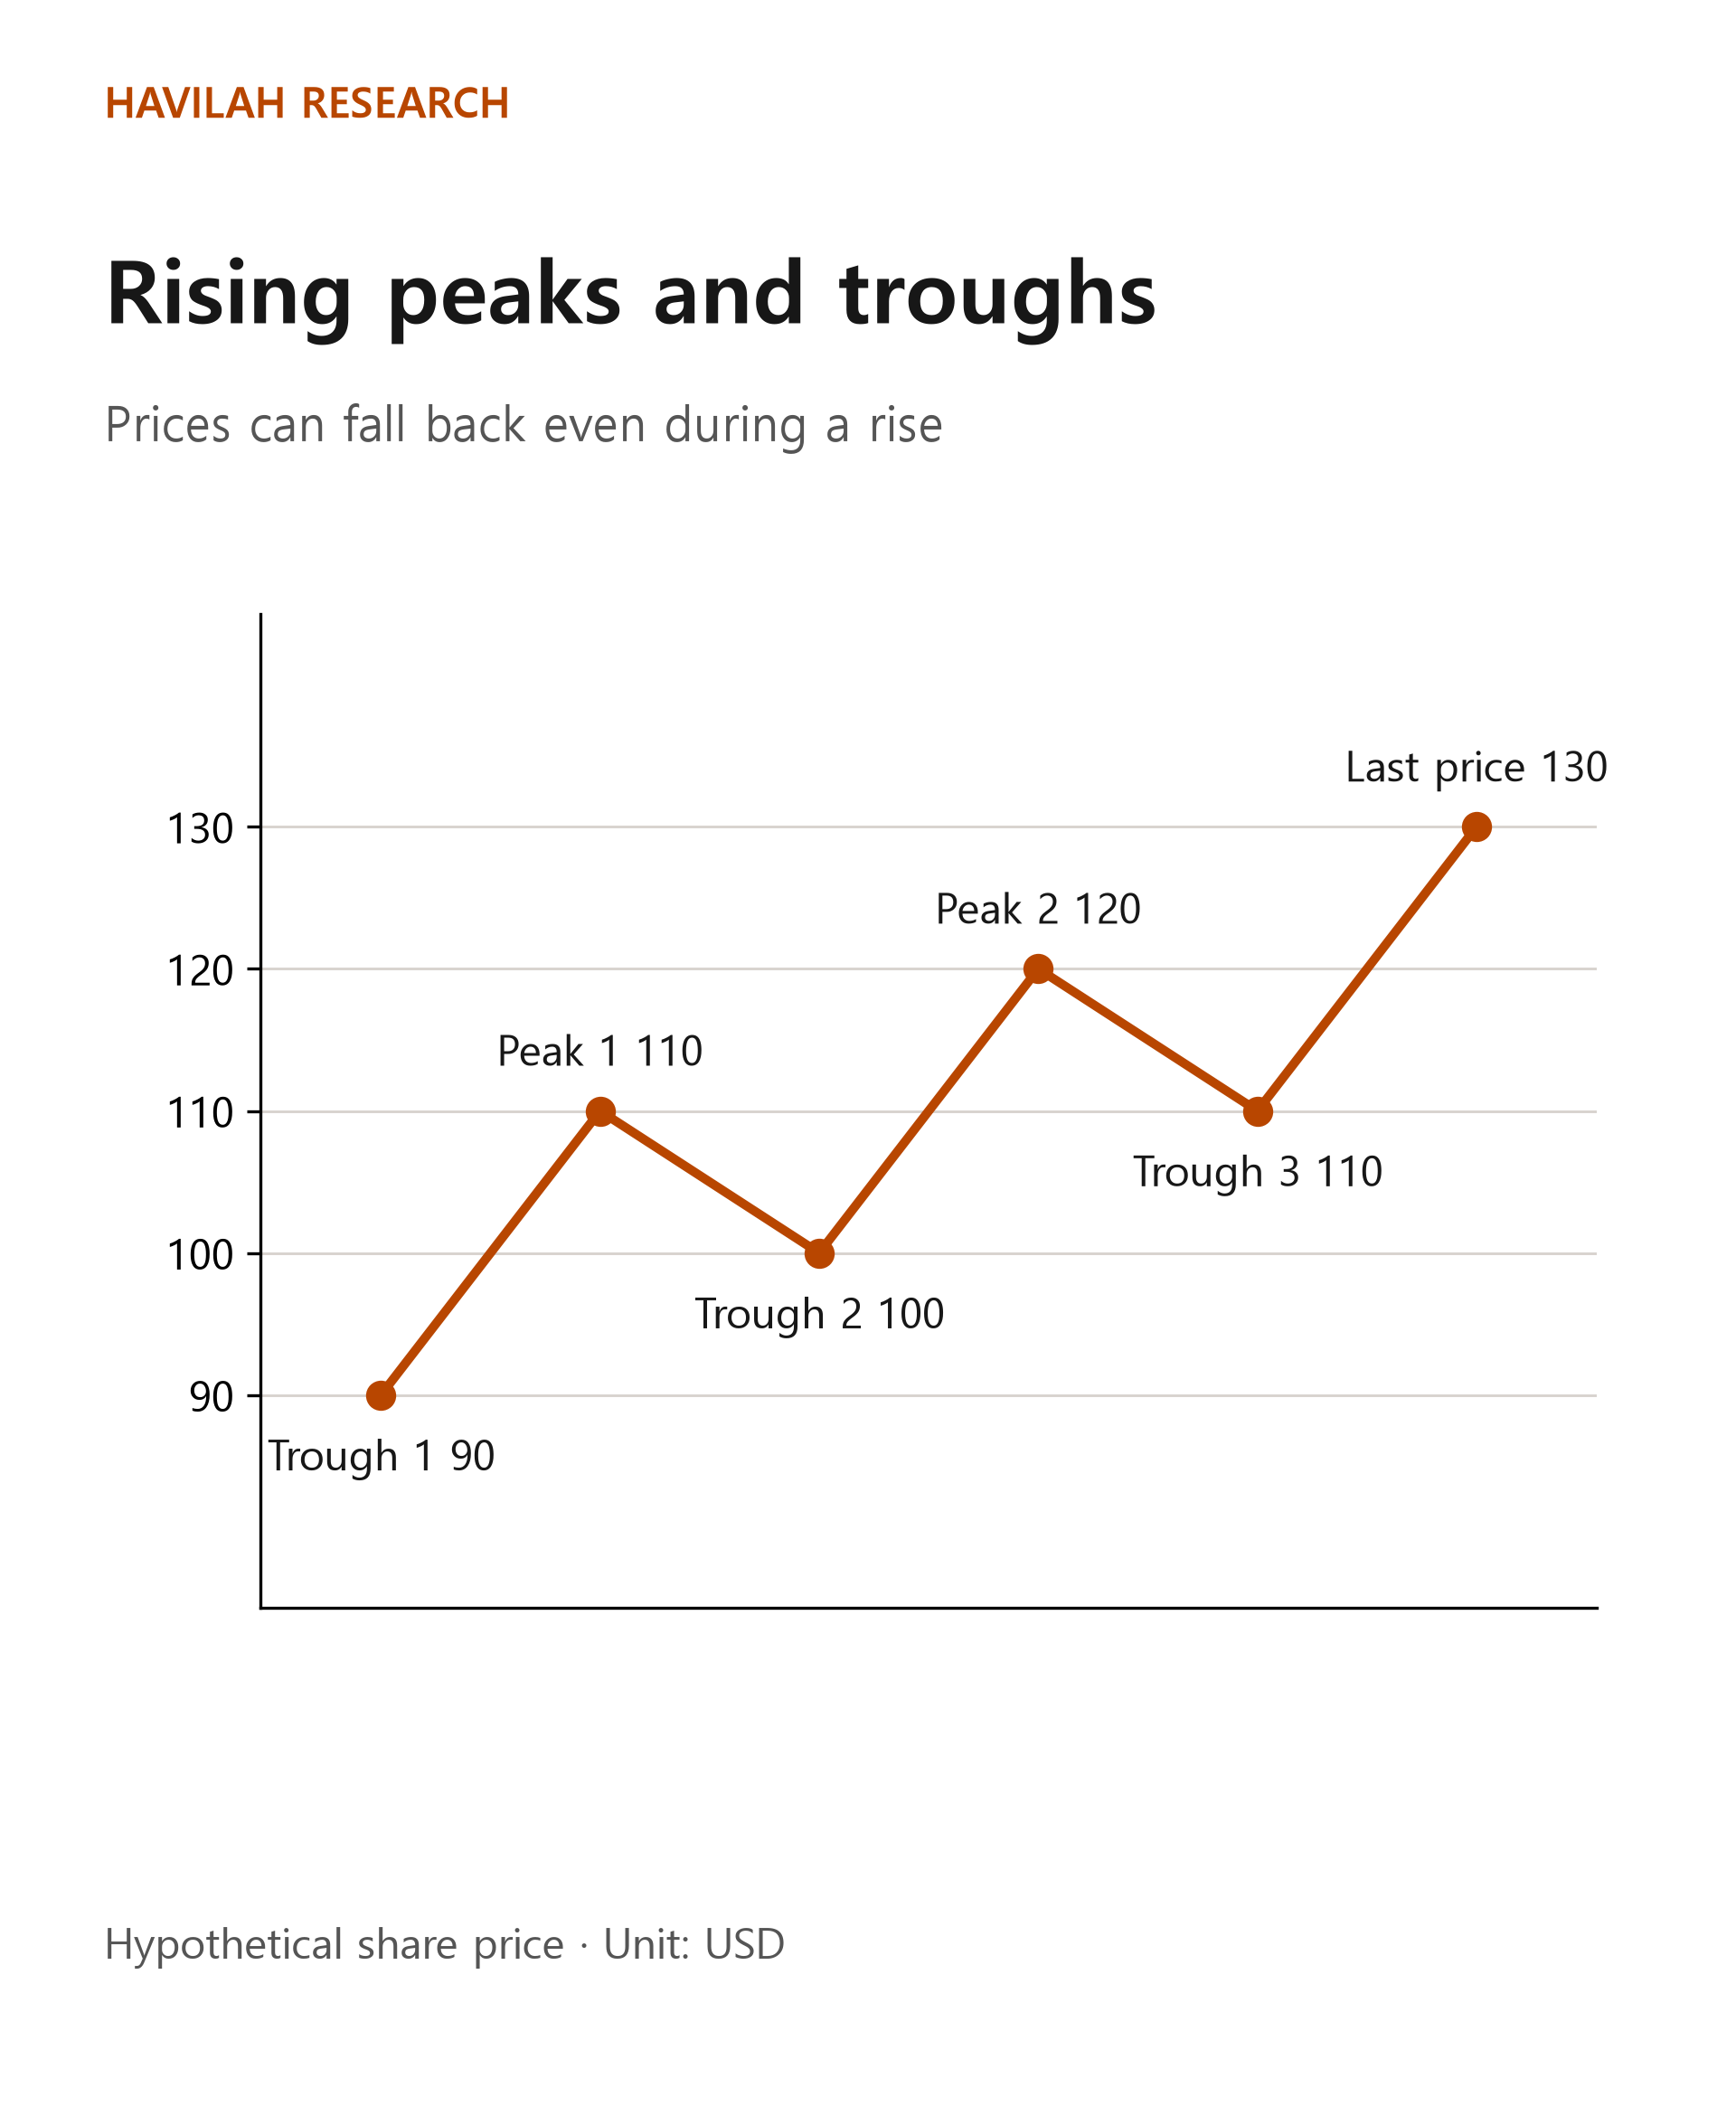
The peaks rose from $110 to $120. The troughs also rose, from $90 to $100 and then $110. If the price comes back down after reaching $130, $130 becomes the next peak. A pattern like this, in which peaks and troughs both keep rising, is called an uptrend. A pullback along the way does not mean the uptrend has ended right away.
However, the price at the very end of a chart can still go higher or lower. To confirm a past peak or trough, you also need to look at how the price moved after that point. Do not assume that a peak which only became clear later could have been known in advance at the time. The last price in the figure, too, can be confirmed as a peak only if a fall follows.
Falling patterns and sideways patterns
A downtrend is the opposite. If the peaks fall from $130 to $120 and then $110, and the troughs also fall from $110 to $100 and then $90, you can picture a staircase going down. Even if the price rises for a few days along the way, a rebound alone does not mean the whole pattern has changed.
When the peaks and troughs neither rise nor fall clearly but repeat within a similar price range, the price is said to be moving sideways. For example, it may go back and forth several times between about $90 and about $110. The edges of a sideways range may be closer to a rough price zone than to one exact number.
Real charts are not as neat as textbook drawings. Sometimes the peaks get higher while the troughs get lower. In that case, rather than forcing a conclusion that the trend is up or down, it is better to write down that the direction is unclear.
A different period can show a different picture
As you learned in Lesson 153, daily candles group prices one day at a time and weekly candles one week at a time. A stock that has fallen for a long time can rebound over the last few days, and a stock in a long rise can pull back for a few weeks. Descriptions based on different periods do not necessarily conflict.
Let's look at real historical data. Below are historical daily prices of U.S. stocks grouped by week: each week's high and low from October 21 to November 8, 2024. Prices are in dollars, rounded to the cent. Old data is not a current investment signal.
| Stock | Week of October 21: high / low | Week of October 28: high / low | Week of November 4: high / low |
|---|---|---|---|
| Apple | 236.85 / 227.76 | 234.73 / 220.27 | 228.66 / 219.71 |
| Microsoft | 432.52 / 413.75 | 438.50 / 406.30 | 426.85 / 405.57 |
| Coca-Cola | 70.33 / 66.58 | 67.40 / 64.89 | 65.47 / 63.18 |
For Apple and Coca-Cola, the weekly highs and the weekly lows both fell in turn over these three weeks. For Microsoft, the high rose in the second week, but the low fell. The same three weeks look different for each stock. However, each week's highest and lowest prices can come on different days within that week. Three weekly numbers alone cannot tell you the confirmed order of peaks and troughs, or the whole longer trend.
If you look at the last two trading days of that final week on daily candles, you see yet another movement. Each cell shows that day's high / low / volume, with prices rounded to the cent as in the table above. Volume is the number of shares traded that day.
| Stock | November 7 | November 8 |
|---|---|---|
| Apple | $227.88 / $224.57 / 42,137,691 shares | $228.66 / $226.41 / 38,328,824 shares |
| Microsoft | $426.85 / $419.88 / 19,901,782 shares | $426.50 / $421.78 / 16,891,414 shares |
| Coca-Cola | $64.39 / $63.60 / 14,856,051 shares | $64.24 / $63.74 / 14,719,308 shares |
For Apple, both the daily high and the daily low rose over the last two days, but volume fell. For Microsoft and Coca-Cola, the high fell and the low rose. Two days do not give you enough information to label a confirmed uptrend or downtrend. Volume is only reference material for examining a move; it is not a buy or sell signal in itself.
How should you look at trends when making investment decisions?
First, look at the broad trend on the weekly candles of a stock you are interested in, then check recent movements on its daily candles. Mark where the noticeable peaks and troughs are in each period. If the two periods look different, rather than choosing which one is right, think about which information matters for your investment time frame.
For example, if you have judged a stock to be in an uptrend, you can decide in advance whether you will treat a fall below the most recent trough as a sign that your judgment has weakened. But the price may dip below that level briefly and come back, or after news it may trade far below the price you wanted. Do not assume that you will always be able to sell at a particular price.
Above all, the fact that a share price is rising is different from a judgment that the company is trading at a good price. You also need to look at the company's business and results, your investment goals and the loss you can bear.
Points to remember
An uptrend is a pattern in which peaks and troughs rise together, and a downtrend is one in which both fall together. At times the price moves sideways, or the direction is hard to judge. Past patterns do not guarantee the future, and a single rebound or a single break below a level is not enough to decide the next direction.
In the next lesson, we will look at how to connect these peaks and troughs with lines, and what to watch out for when you use those lines.