
One investor looks at a stock and says, "It has been rising lately." Another says, "It is still falling." Neither of them is necessarily wrong. One may be looking at the last few days, and the other at several months.
When you read a chart, how long a period is grouped into one unit matters as much as the price itself.
The same prices, grouped in different sizes
A daily candle shows one day's prices as a single candle. A weekly candle groups one week's prices, and a monthly candle one month's prices, into a single candle each. Each candle holds the open, high, low and close for its period.
For example, if a week had five trading days, the open of the weekly candle is usually the open of the week's first trading day, and its close is the close of the week's last trading day. The high is the highest price recorded that week, and the low is the lowest. A week with a market holiday has fewer trading days. On a real chart, check the service's settings to see whether trading outside the regular session (extended-hours trading) is included.
Because weekly candles summarize daily movements, they are easier to take in at a glance. In exchange, they hide how the price moved on each day within the week. Monthly candles summarize an even longer stretch, but they do not show in what order the price rose and fell within the month.
A stock can be up over a short period and down over a longer one
Suppose a hypothetical stock closed last month's final trading day at $100, and the closes at the end of each of this month's four weeks were $100, $90, $80 and $90, in that order. These numbers are for illustration, not a real share price.
In the last week, the close rose from $80 the week before to $90. That is a rise of 10 ÷ 80 × 100 = 12.5%. But this month's final close of $90 is $10 lower than last month's final close of $100, so the change between the month-end closes is −10%.
The most recent week rose, while the month that includes that same week fell. The two statements do not contradict each other, because each one compares from a different starting point. The example compares only closing prices, so it cannot tell you the highest and lowest prices within each week or within the month.
Which view you look at first also depends on your investment time frame. If you are planning a trade over a few days, you can look closely at recent daily changes. If you are thinking in years, you can look at the monthly trend first and then check recent daily movements. No chart, whatever its period, settles the future for you.
A linear chart shows equal amounts as equal distances
There are also different ways to space the price scale on the vertical axis. A linear chart shows price changes of the same dollar amount as the same vertical distance. For example, a rise from $10 to $20 and a rise from $20 to $30 are both $10 changes, so they take up the same distance.
But the percentage change an investor experiences is different. From $10 to $20 is a 100% rise, and from $20 to $30 is a 50% rise. Both changes are $10, but they start from different prices.
This does not mean linear charts are not useful. They are intuitive when you compare fixed dollar differences or look at a fairly narrow price range. But when a stock's price level has changed a lot over a long period, movements at the higher prices can look bigger on the screen.
A log chart shows equal percentages as equal distances
A logarithmic (log) chart shows price changes of the same percentage as the same distance on the vertical axis. If a hypothetical price went from $10 to $20 and then to $40, it doubled both times, rising 100% each time. So on a log chart, the vertical gap from 10 to 20 is the same as the gap from 20 to 40.
On a linear chart, by contrast, the first change is $10 and the second is $20, so the second gap is twice as large. The figure below shows the same three prices on two different scales. The prices themselves have not changed.
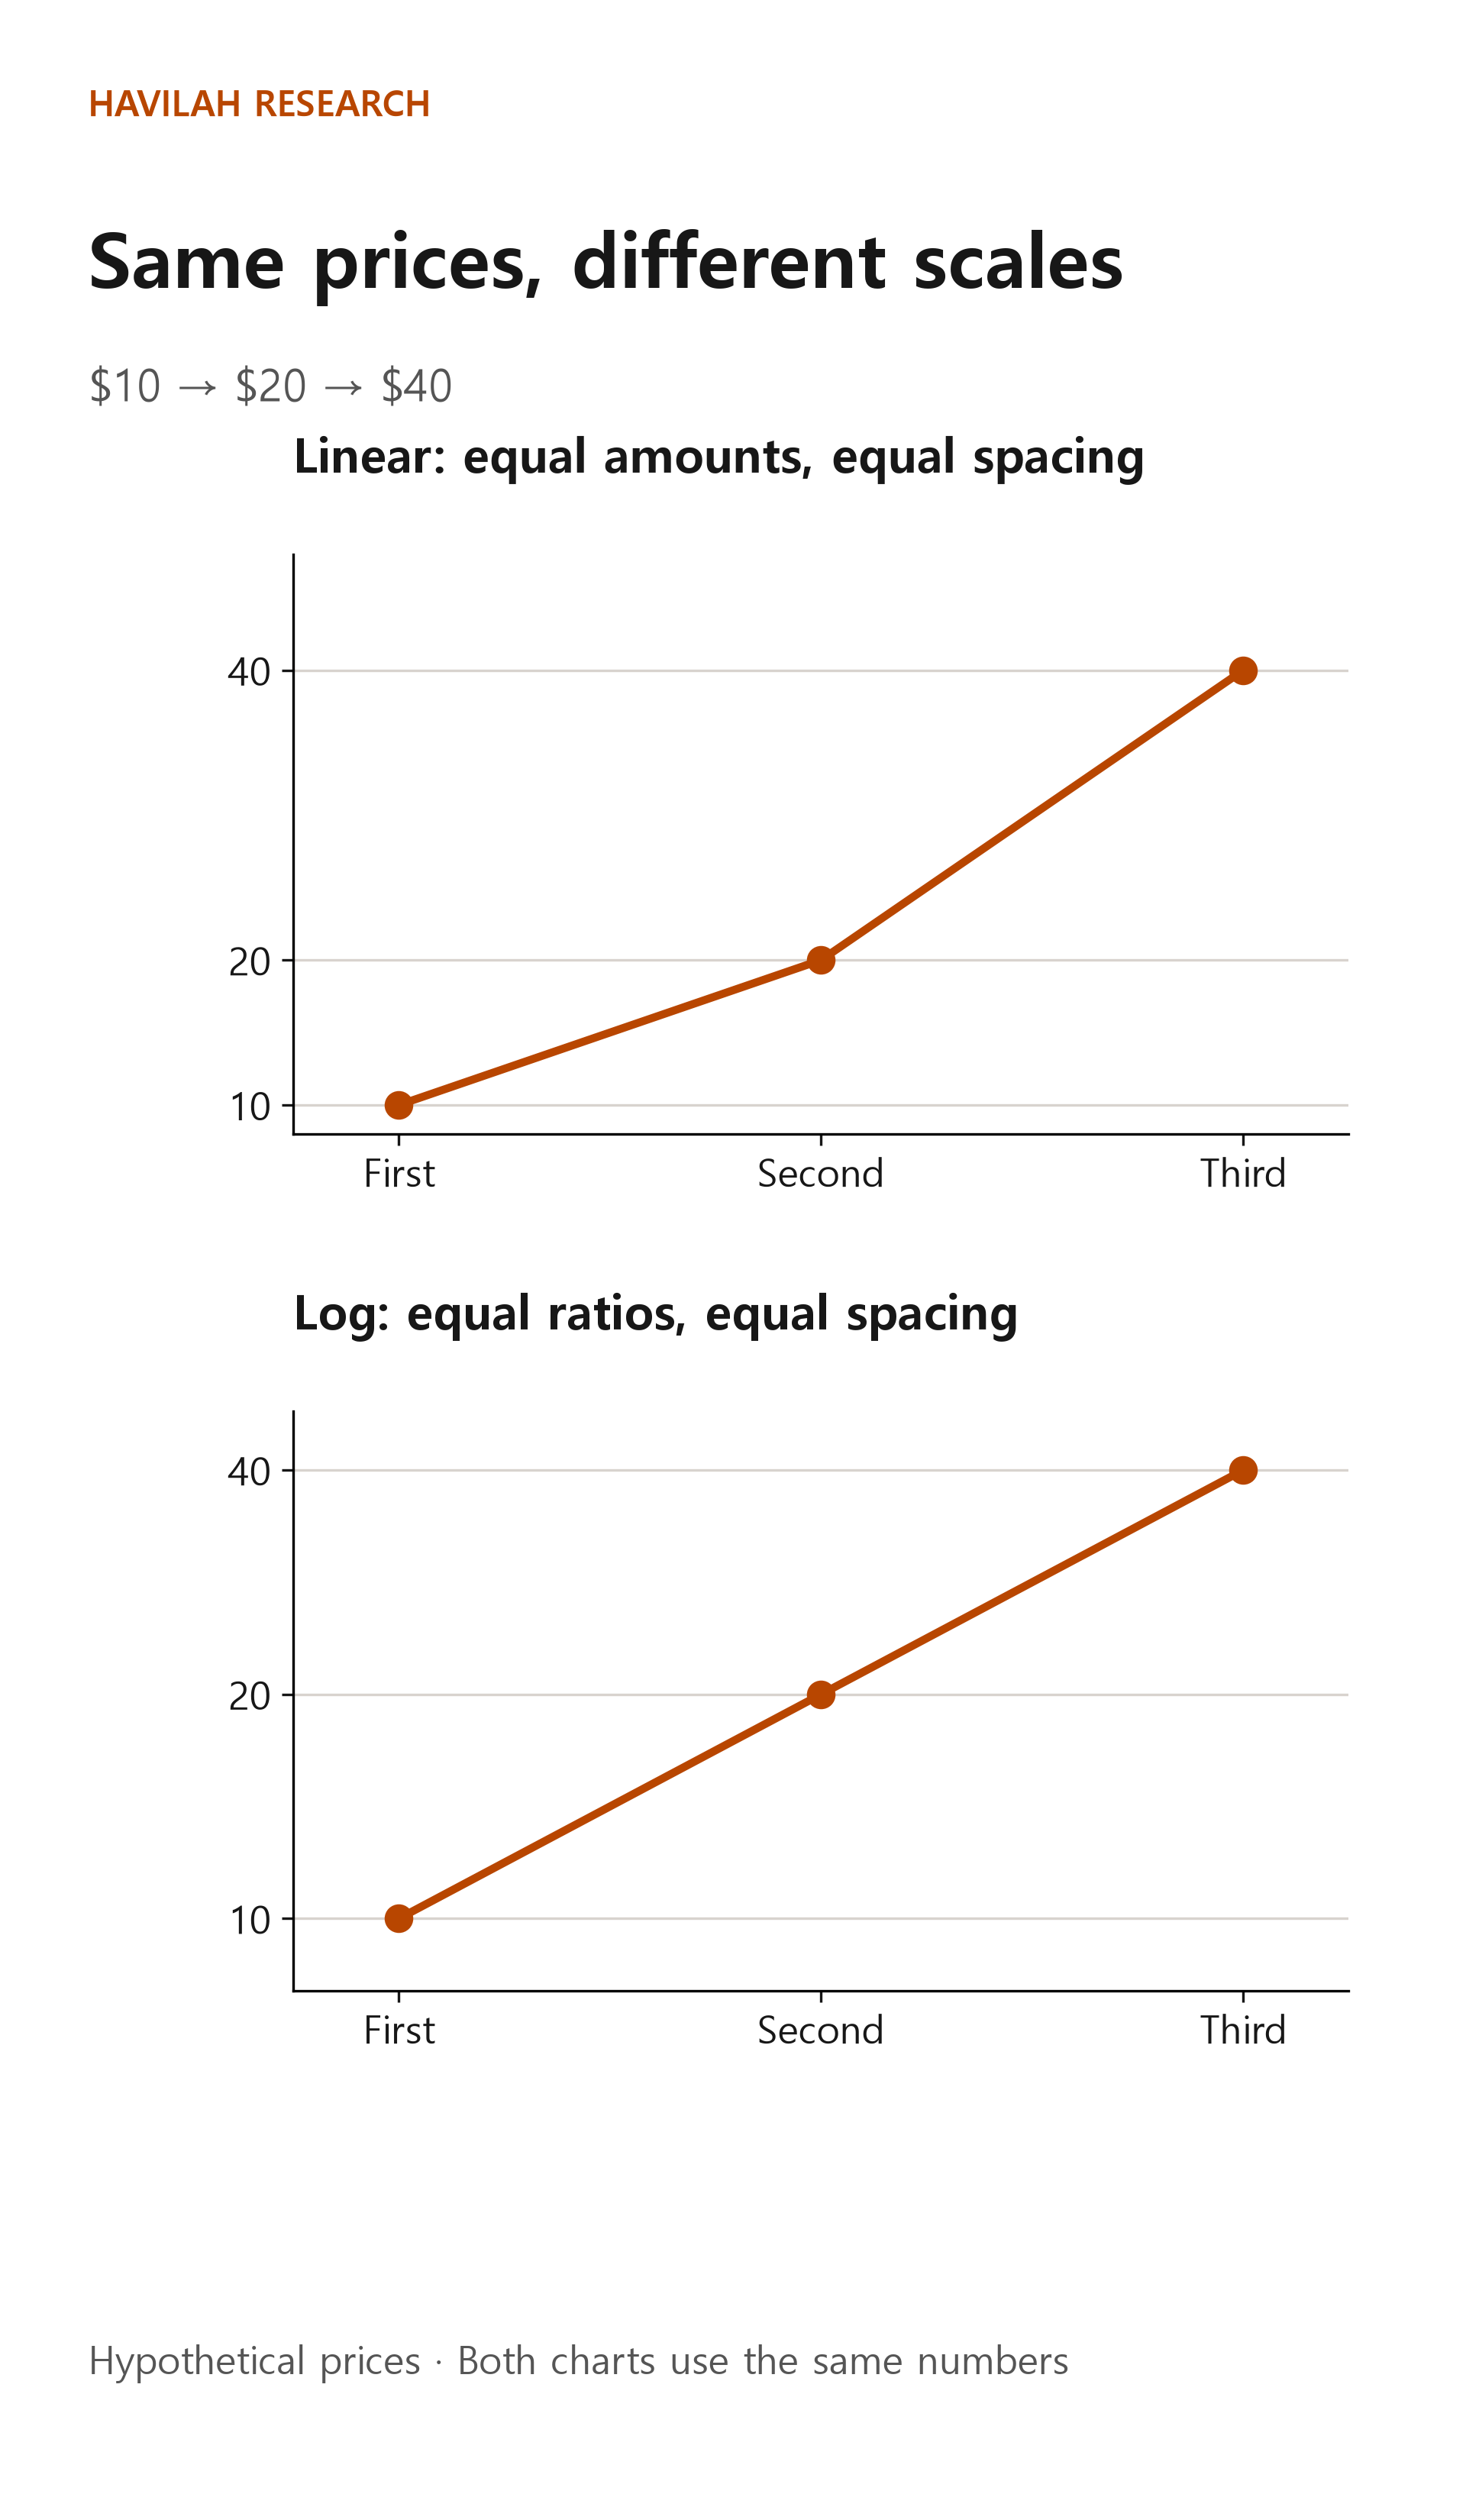
A log chart helps you follow percentage changes when a price has multiplied several times over a long period. But switching a chart to log does not change your returns or make signals more accurate. A log scale cannot be used for prices of $0 or below.
Also, when you draw lines, note which scale and which period you drew them on. When the view changes, a line joining the same points can take a different shape. Rather than treating the shape you see on one screen as the right answer, check the basis of the chart first.
What should you decide first when you look at a chart?
First, decide how long you plan to invest. Look at the big picture on a view that covers a little more than that period, and if needed, switch to a shorter view to check recent prices and volume.
Next, check whether each candle is still forming. If this week is not over yet, the close, high and low of this week's candle can still change. If you compare an unfinished candle with completed past candles as if they were the same, it is easy to misread it.
Finally, check whether the prices are adjusted for splits or dividends, and which trading hours the chart includes. If the display method or the range of data differs, two services can show different numbers.
Daily, weekly and monthly candles, and linear and log scales, are like different pairs of glasses. None of them produces a better price. Choose the period and scale that fit the question you are trying to answer, and check whether the same conclusion still holds on other views.