
You have found a company that looks good. But its share price is rising fast, and you are not sure whether it is all right to buy now. At other times the price is falling, and you wonder how long you should wait.
This is when many investors look at a chart. A chart shows the prices at which a stock traded in the past and how its price moved. But looking at a chart does not tell you the next price in advance. First, let's separate the facts a chart shows from the ways those facts can be interpreted.
What does technical analysis look at?
Technical analysis is a method that mainly examines past prices and volume. Volume is the number of shares traded over a given period. For a share to be sold, someone also has to buy it, so volume alone cannot tell you how many more buyers there were than sellers.
When you look at price and volume together, you can see which way a share price moved over a particular period and whether trading was heavier than usual. But volume can rise for many reasons. There may have been an earnings release or major news, or another event may have played a part, such as a change in the stocks that make up an index. You cannot read the minds of all investors from the numbers alone.
Fundamental analysis focuses on a company's business, finances and value. A chart can be used to check how the prices actually set in the market have moved. The two methods answer different questions, and neither guarantees investment results.
How do daily and weekly candles differ?
A daily candle shows one day's price movement as a single unit, and a weekly candle groups one week's movement into a single unit. A candle here is a way of showing the prices of a period together in one mark. For a day, you can see the price at which trading started, the highest and lowest prices, and the last price. The last price is called the closing price, or the close.
Daily candles show each day's changes in detail, but they include many small movements. Weekly candles bundle several days of movement into one piece, which makes a longer trend easier to see. In exchange, they show less than daily candles about what happened in the middle of the week. This does not mean that one of them is always more accurate.
For example, if a hypothetical stock closed at $100 on Monday and at $105 on Friday, the change between those closes is $5, or 5%. But the two closes on Monday and Friday cannot tell you whether the price fell as low as $90 during the week and then recovered. Comparing Monday's close with Friday's close is also different from a weekly return, which compares the previous Friday with this Friday.
Comparing two periods with real prices
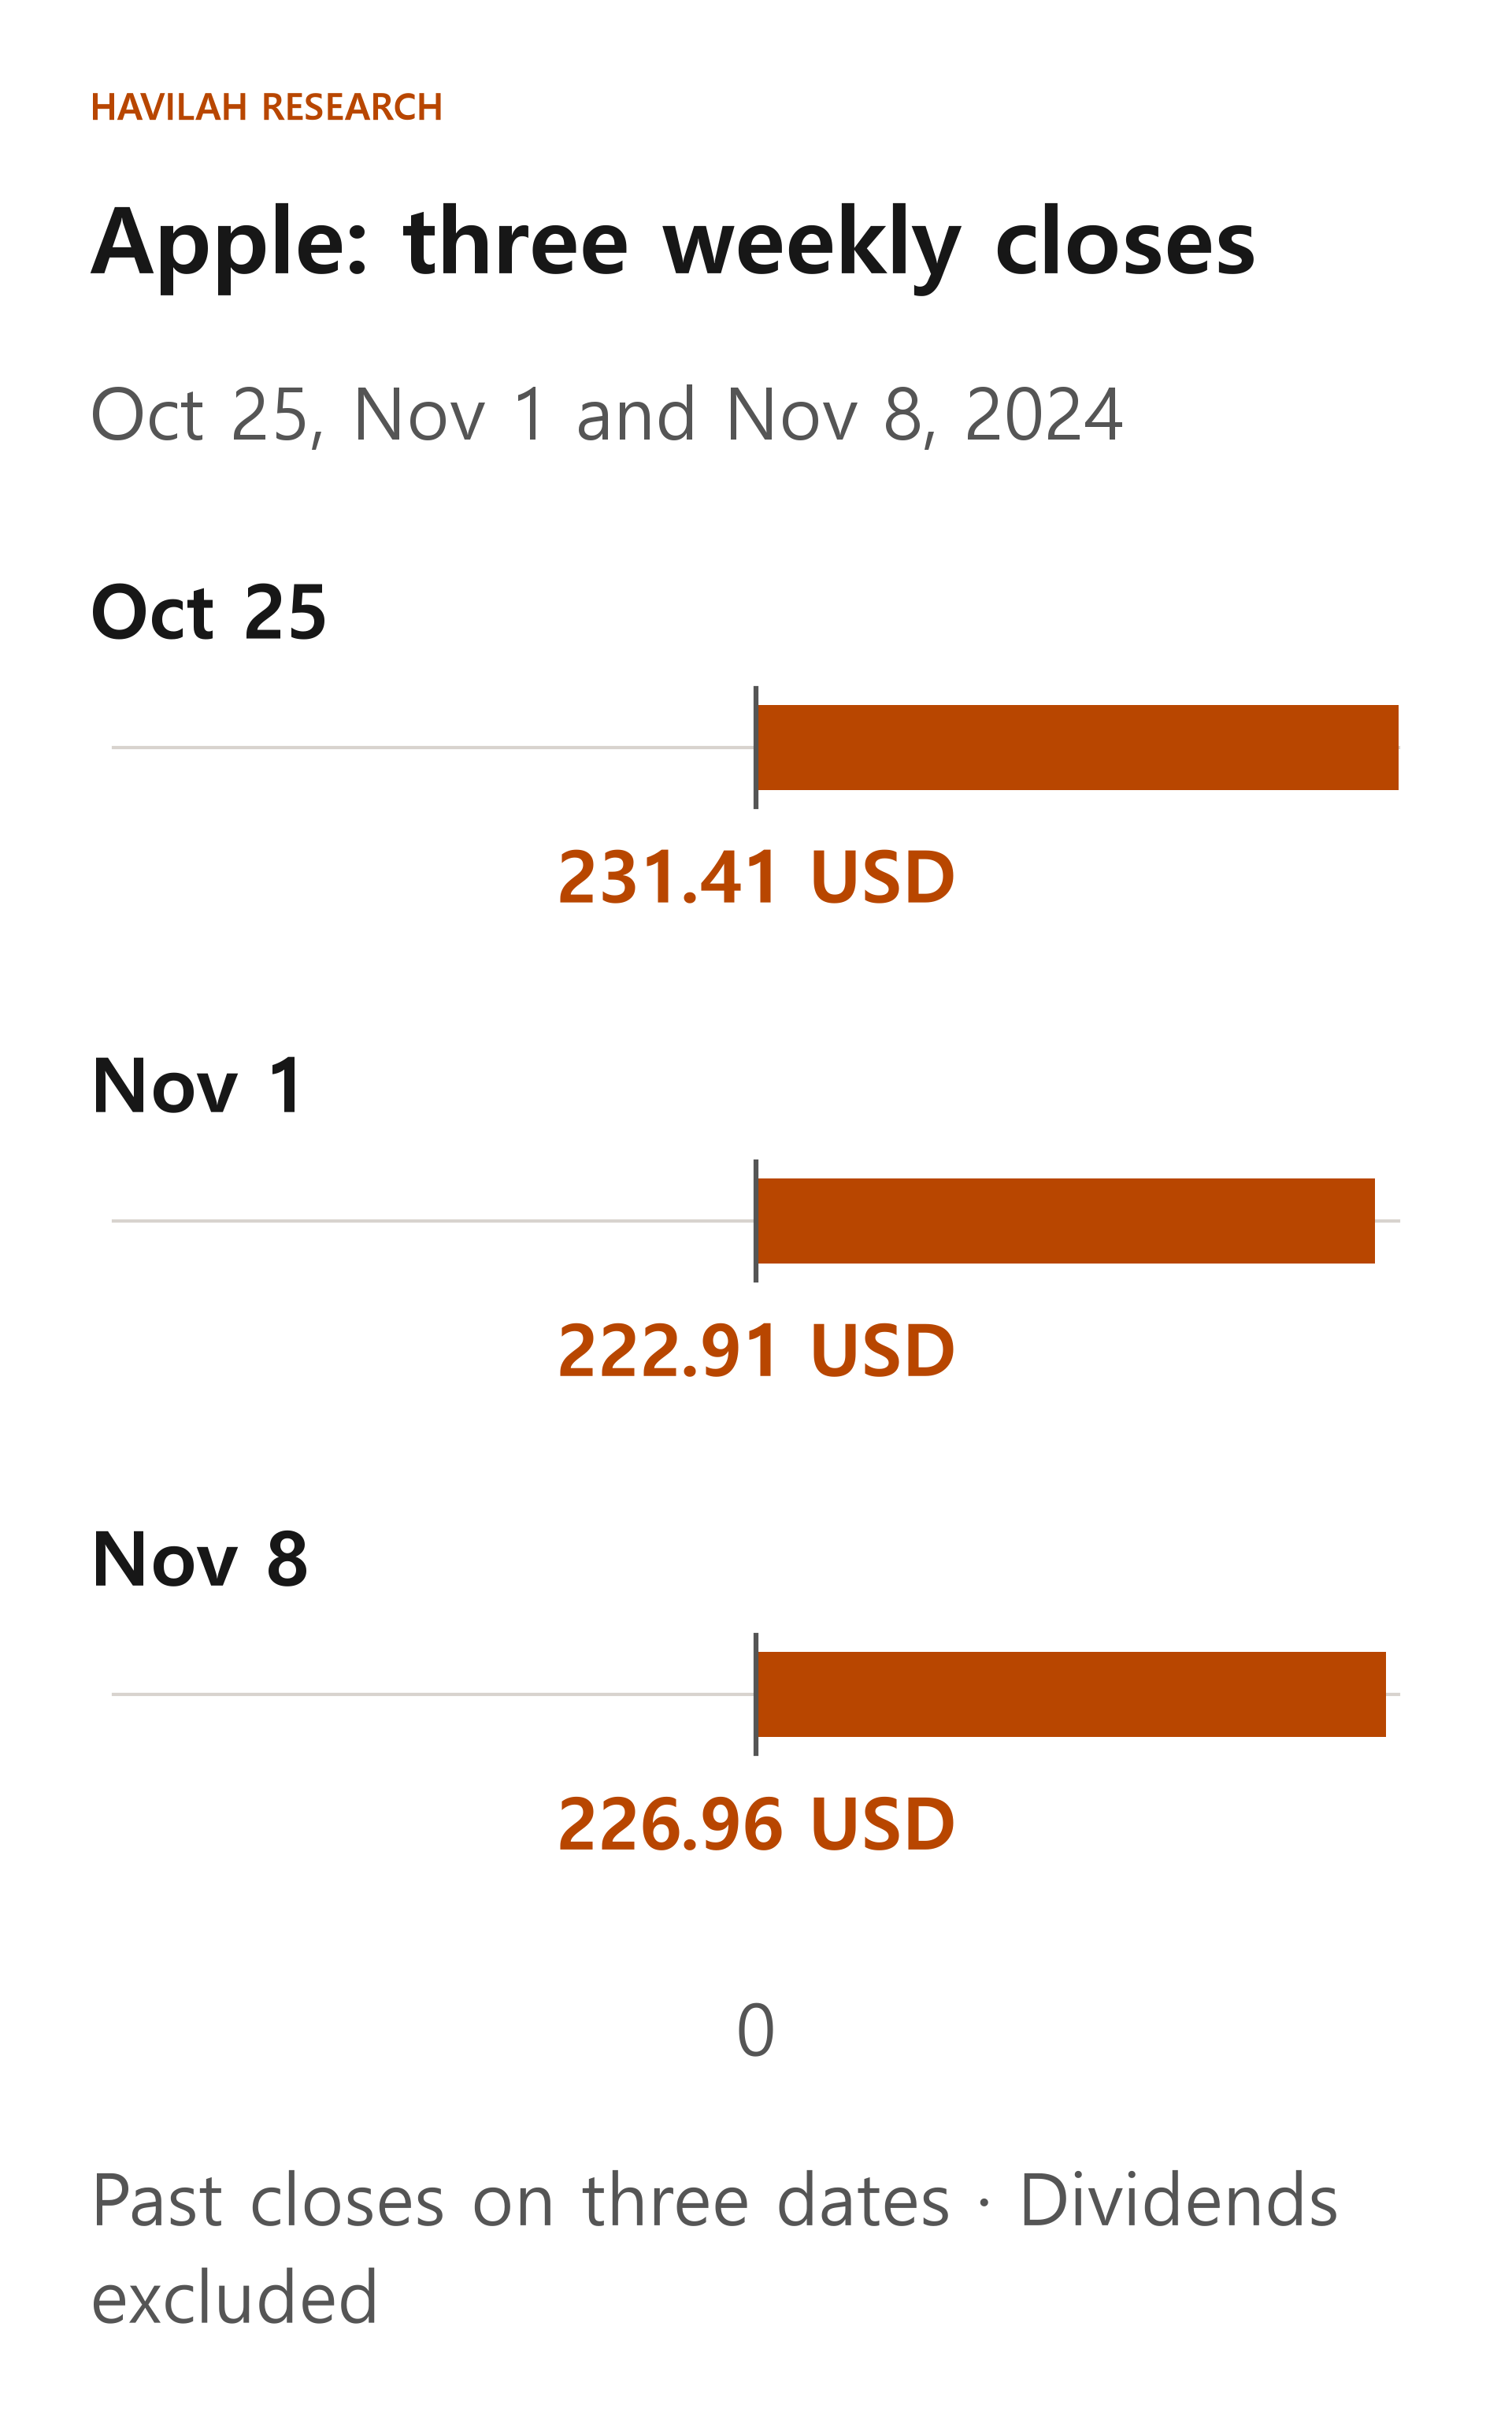
Here is a past example from fall 2024. The table shows, in dollars, three companies' closing prices on the last trading day of each week. It is practice in reading prices from that time, not a current quote or a recommendation. Dividends received are not added to this price comparison. Price data can show different numbers from one service to another, depending on whether past prices are adjusted for dividends or stock splits.
| Company | October 25 | November 1 | November 8 |
|---|---|---|---|
| Apple | $231.41 | $222.91 | $226.96 |
| Microsoft | $428.15 | $410.37 | $422.54 |
| Coca-Cola | $66.92 | $65.01 | $63.92 |
Across these three end-of-week closes, Apple and Microsoft were lower at the second close and higher again at the third. Coca-Cola's three closes fell one after another. This is an observation across three chosen dates. It does not describe every movement in between or the trend over a longer period.
In the same data, the daily closes on October 31 and November 1 show Apple falling from $225.91 to $222.91 and Coca-Cola from $65.31 to $65.01. Microsoft, on the other hand, rose from $406.35 to $410.37. A handful of weekly closes can miss a one-day difference like this.
Microsoft's volume was about 53.97 million shares on October 31 and about 24.23 million shares the next day. You can confirm that volume on one day was higher than on the next, but that number alone cannot tell you for certain which way the share price will go next or why people traded.
The same data can be interpreted in different ways
An uptrend is a period in which prices generally rise, and a downtrend is the opposite. But the same chart can look different depending on which period you choose. Looking only at the last few days, a stock may be rebounding, yet over several months it may be falling.
Some investors use the terms support and resistance for price zones where prices often stopped or turned back in the past. Support is a price zone where people watch for a fall to stop, and resistance is a price zone where they watch for a rise to stop. This is not a law that prices must stop at an exact line. The price can pass through the zone and then come back.
If you draw lines on a chart and later pick out only the parts where the result fit well, it looks easier than it really is. You should also look at when and by what rule each line was drawn, and at the cases where it did not work. There is no guarantee that a rule that worked well in the past will produce the same results in the future.
How can you use it in investing?
Before you open a chart, think about your investment time frame and the loss you can bear. Then look at the broad trend on the same stock's weekly candles, and at recent changes on its daily candles. Also check whether there was an earnings release or an important filing around the time the price moved.
Even if a chart makes you consider buying, you should also look at the company's business and finances and at the expectations built into the current price. Your trade will not necessarily be filled at the price you want, and fast price moves or trading costs can produce results different from your plan.
A chart is a tool for organizing what has already happened. Use it as a basis for thinking through the different situations that could come next, and for deciding in advance how you will respond if your expectations turn out to be wrong.