
When you open a chart, you see it packed with red, blue or green bars. Each one can feel like a complicated signal, but the first thing a single candle tells you is the range of prices at which the stock actually traded during a set period of time.
Within that candle, you only need to find four numbers: the starting price, the highest price, the lowest price and the last price.
The four prices in one candle
Let's take a daily candle, which covers one day, as an example.
- Open (opening price): the price set when trading starts in the period
- High: the highest price recorded during the period
- Low: the lowest price recorded during the period
- Close (closing price): the last price of the period
If the period is a day, these are the day's prices; if it is a week, they are that week's prices. The values shown can differ depending on things such as whether the exchange and the chart service include trading outside the regular session (extended-hours trading), so check the settings. If the market has not closed yet, the last price, the high and the low can all keep changing.
Reading the body and the wicks
Suppose a hypothetical stock starts the day at $100, reaches $110 at its highest and $95 at its lowest, and ends the day at $105. These numbers are for illustration, not the price of a real stock.
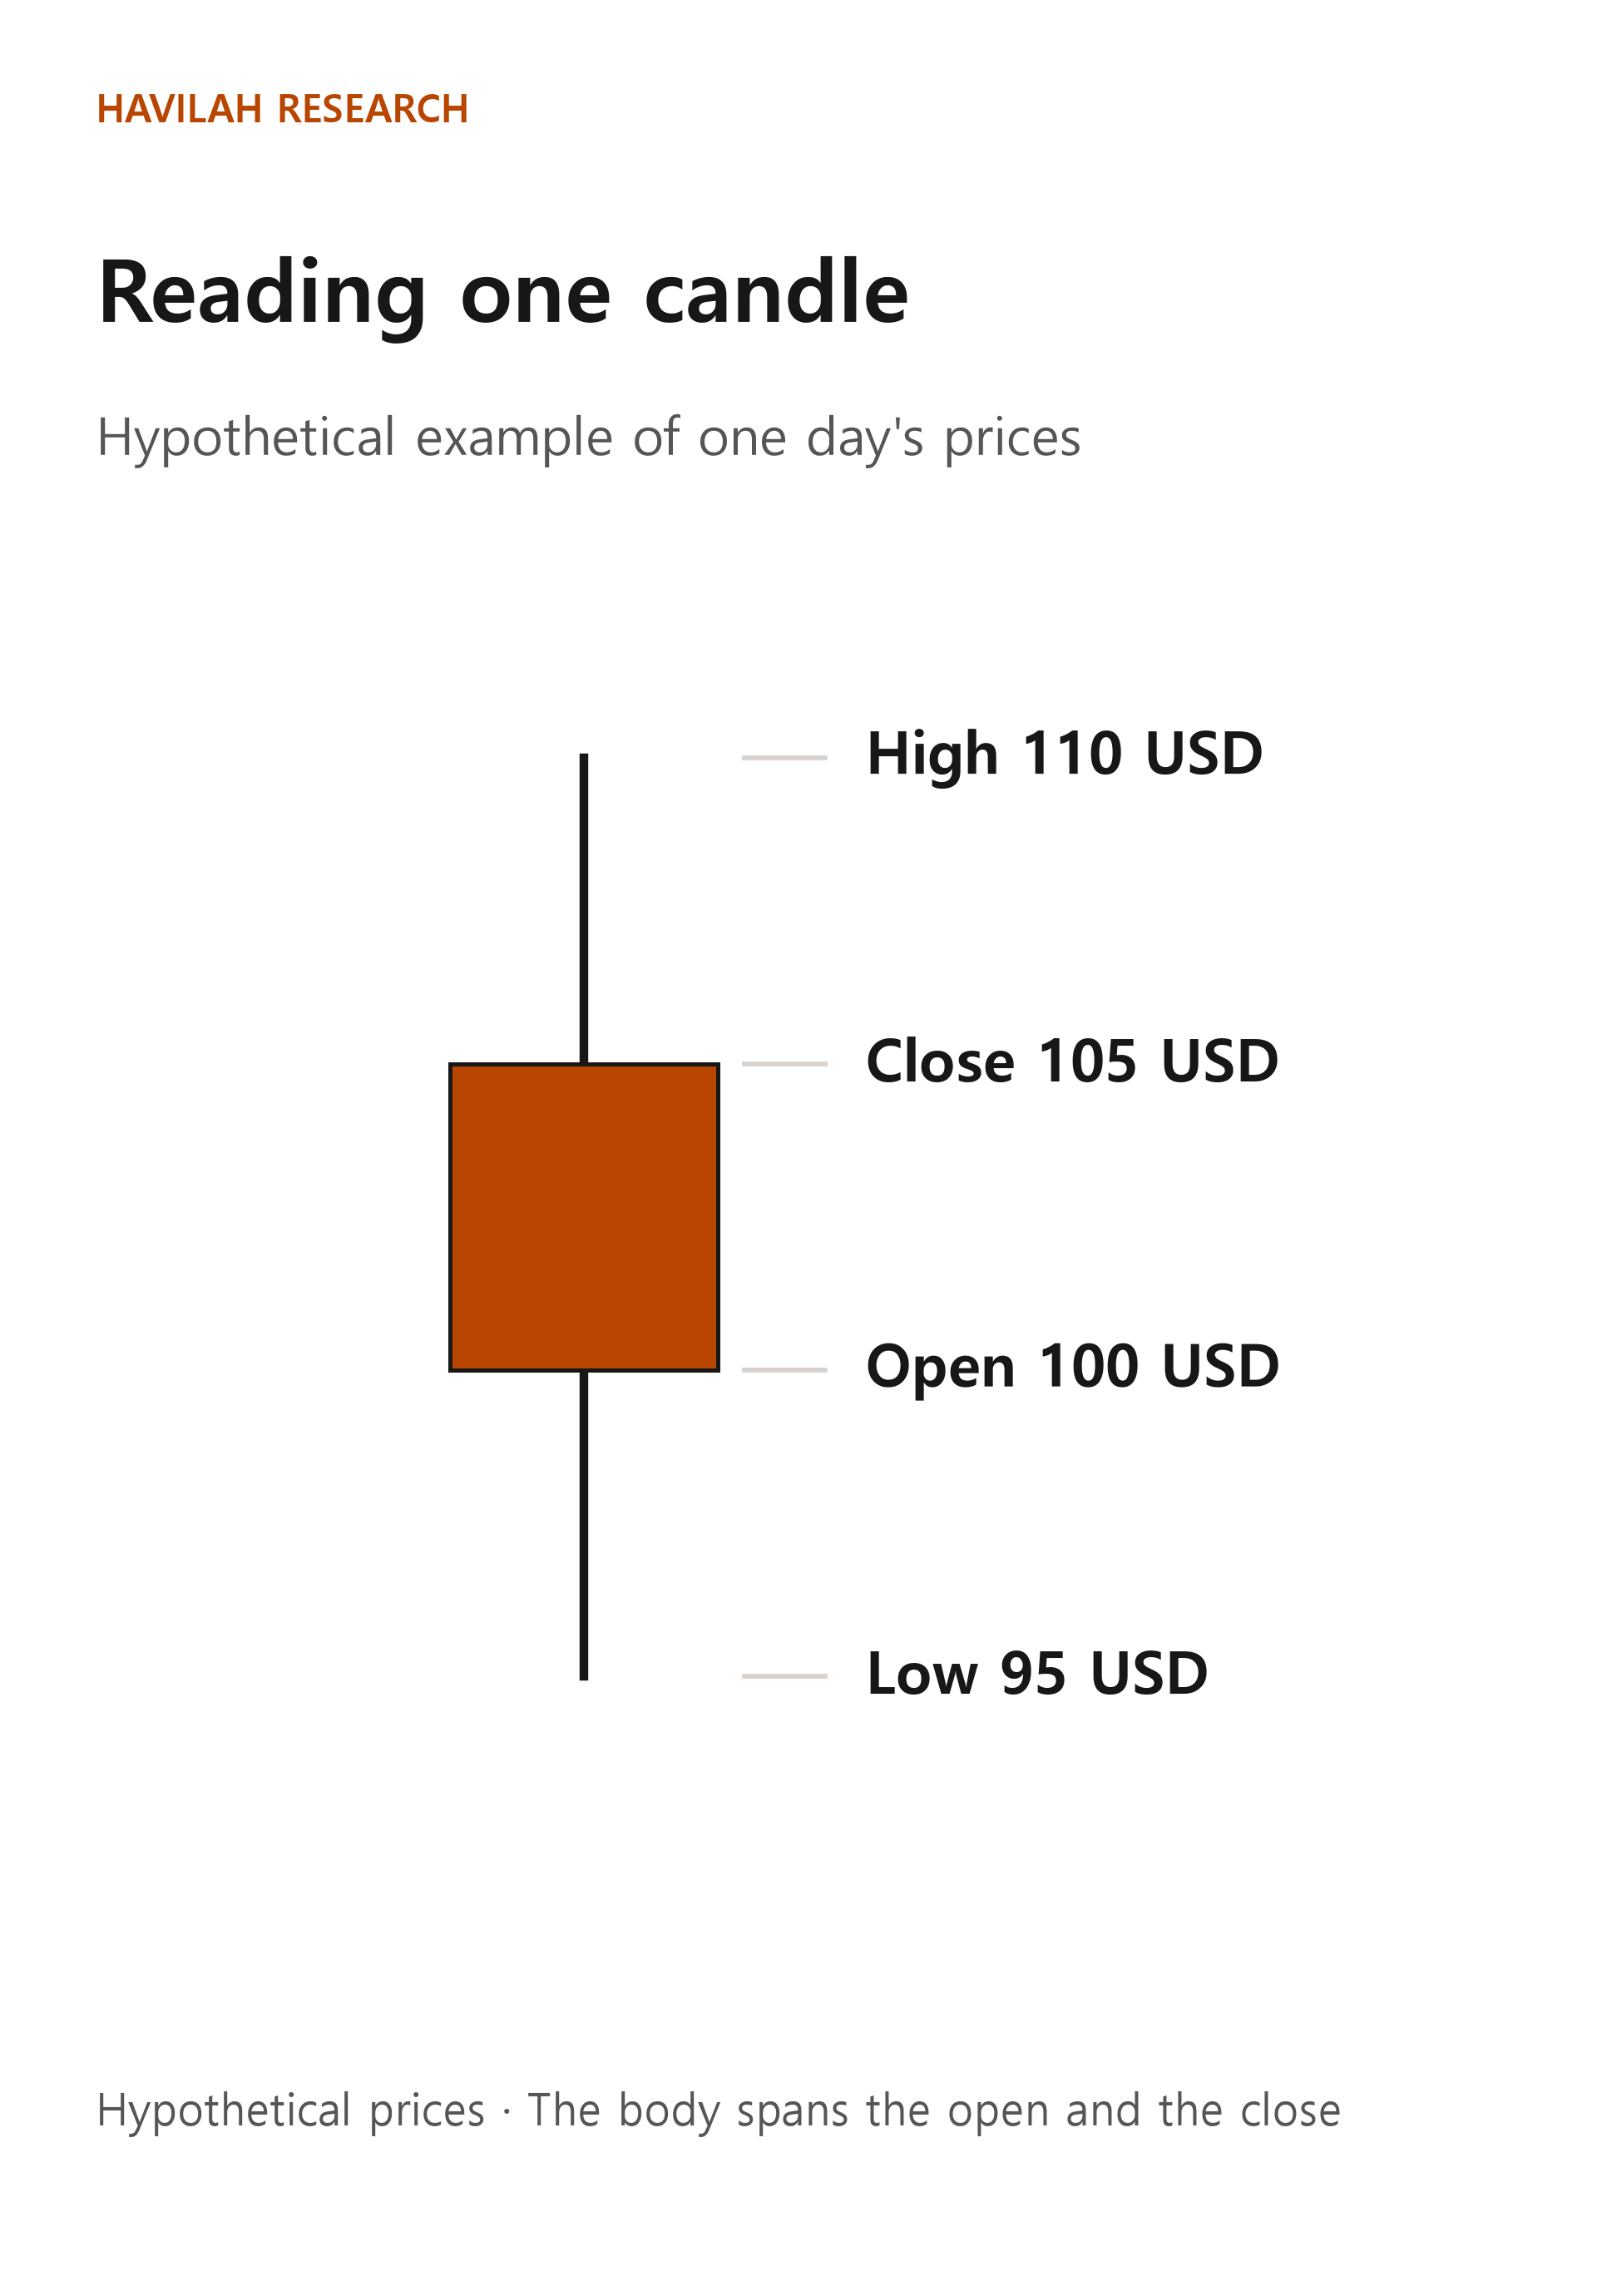
The thick rectangular part is called the body. The two ends of the body are the open and the close. In this example, the body runs from $100 to $105.
The thin lines that extend above and below the body are called wicks (also called shadows). The top end is the high of $110, and the bottom end is the low of $95. The upper wick runs from $105 to $110, and the lower wick from $95 to $100.
The close that day is $5 higher than the open. Measured from the open, that is a rise of 5 ÷ 100 × 100 = 5%. The range between the high and the low is 110 − 95 = $15. This is the price range for the whole day, not the day's return.
When the close is higher than the open, the candle is called an up candle; when it is lower, a down candle. The colors can differ depending on the chart service's settings. Rather than memorizing colors, make a habit of checking where the open and the close are. If the open and the close are the same, the body may be drawn as a very thin line.
Can an up candle still be lower than the day before?
Yes. An up candle compares that day's open with its close. Comparing with the previous day's close is a different yardstick.
In the hypothetical example above, assume the previous day's close was $110. Today the stock opened at $100 and closed at $105, so it rose from today's open. But compared with the previous close of $110, it is $5 lower, and 5 ÷ 110 × 100 is a fall of about 4.55%.
There is sometimes a difference between the price at which one day ended and the price at which the next day starts. This difference is called a price gap, or simply a gap. There can be many reasons, such as news released overnight or changes in orders, but you cannot pin down the exact cause from the shape of a candle alone.
Look at volume separately, alongside the candles
Many charts show bars below the prices. Those bars usually show volume, the number of shares traded in each period. The length of a candle's body does not represent volume.
If 10,000 shares of a hypothetical stock traded in a day, it means exactly that: 10,000 shares changed hands. Every trade has a buyer and a seller, so volume alone cannot tell you which side had more people. High volume confirms that trading was active that day, but it does not guarantee a rise or a fall the next day.
It is also important to compare like with like. If you compare today's volume, before the market has closed, directly with yesterday's volume for the full day, you can misread it. Volume on daily candles and volume on weekly candles also cover different periods.
How to read a real candle
Let's look at Microsoft's historical daily price data for October 31, 2024. The open was $415.36, the high $416.16, the low $406.30 and the close $406.35. Because the close was below the open, the candle for this period is a down candle. Volume was about 53.97 million shares. This is only a past example, not a current price or a recommendation to buy or sell.
You can see the day's price range, but these four numbers alone cannot tell you whether the high or the low came first, or why the price moved. If you want to know exactly what happened, check the filings and news for that date separately.
Why you should check adjusted prices
When a company carries out a stock split, such as dividing one share into two, the number of shares and the price basis of one share change. Suppose one share of a hypothetical stock is worth $100 just before a 2-for-1 split. If nothing else moves the price, right after the split you have two shares worth $50 each, and your holding is still worth $100.
If you simply join the old $100 to the post-split $50 on a chart, it can look as though you actually lost half your money. To make comparison easier, past prices are converted to the current share basis; these converted values are called split-adjusted prices. In this example, the pre-split $100 is shown as $50 on the adjusted basis.
However, the adjustment method differs from one data provider to another, and some data also adjust for dividends and other events. An adjusted price does not mean the stock actually traded at that price in the past, either. When you calculate a return, check changes in the number of shares, dividends, fees and taxes. If you add a dividend to prices that already reflect it, you may count it twice.
A single candle summarizes the range over which the price moved. After checking that range and the volume, look at the trend over a longer period and at the company's situation as well. Start from this: a single candle alone does not settle the future.