
A high share price for a good company does not automatically mean it is expensive. Nor do strong recent results necessarily mean the stock is cheap. The important question is how good the future results need to be to explain the current price.
One way to look at this question is a reverse DCF. Earlier, you assumed future revenue and profit and calculated a value from them. This time, you start from the price and work backward to find what assumptions are needed to get close to that price.
Starting from the price
We will use the workbook from Lesson 131 again. It starts from Apple's fiscal 2025 results, but the growth rates and margins after that are all educational assumptions. Because it is a simple example using past data, do not read it as Apple's current value or as the market's actual outlook.
In that lesson, we assumed that revenue grows by 5% a year for 5 years and that the operating margin is 30%. With the other conditions applied as well, such as a discount rate of 10% and a long-term growth rate of 2% after year 5, the calculated value per share was about $91.91.
Now, for the sake of explanation, assume the share price is $100. This is not an actual share price. The $100 is a number chosen to practice the method, and Apple's actual share price may be very different from the value calculated in this exercise.
If the actual share price is much higher than the calculated value, it may mean that explaining that price requires higher growth or margins than in this exercise, or a lower discount rate. If it is much lower, the opposite applies. The gap may also come from the other assumptions held fixed in this exercise. In a real analysis, you enter the market price on the date you checked it and use the same method to find the assumptions it requires.
So what would you need to change for the calculated value to come close to $100?
Working backward to the growth rate
Keep the operating margin at 30% and the other conditions as they are, and adjust only the revenue growth rate for the 5 years.
| Annual revenue growth over 5 years | Calculated value per share (USD) |
|---|---|
| 5% | About 91.91 |
| About 7.09% | About 100.00 |
In this model, you need to enter a growth rate of about 7.09% a year to come close to the hypothetical price of $100. You can check the result by changing "Assumed revenue growth rate" in the workbook step by step, or you can use a spreadsheet feature that searches for a target value.
What you found here is the revenue growth rate for the 5 years. The long-term growth rate of the cash after year 5 was left at 2%. The two growth rates refer to different periods and different things.
More than one answer produces the same price
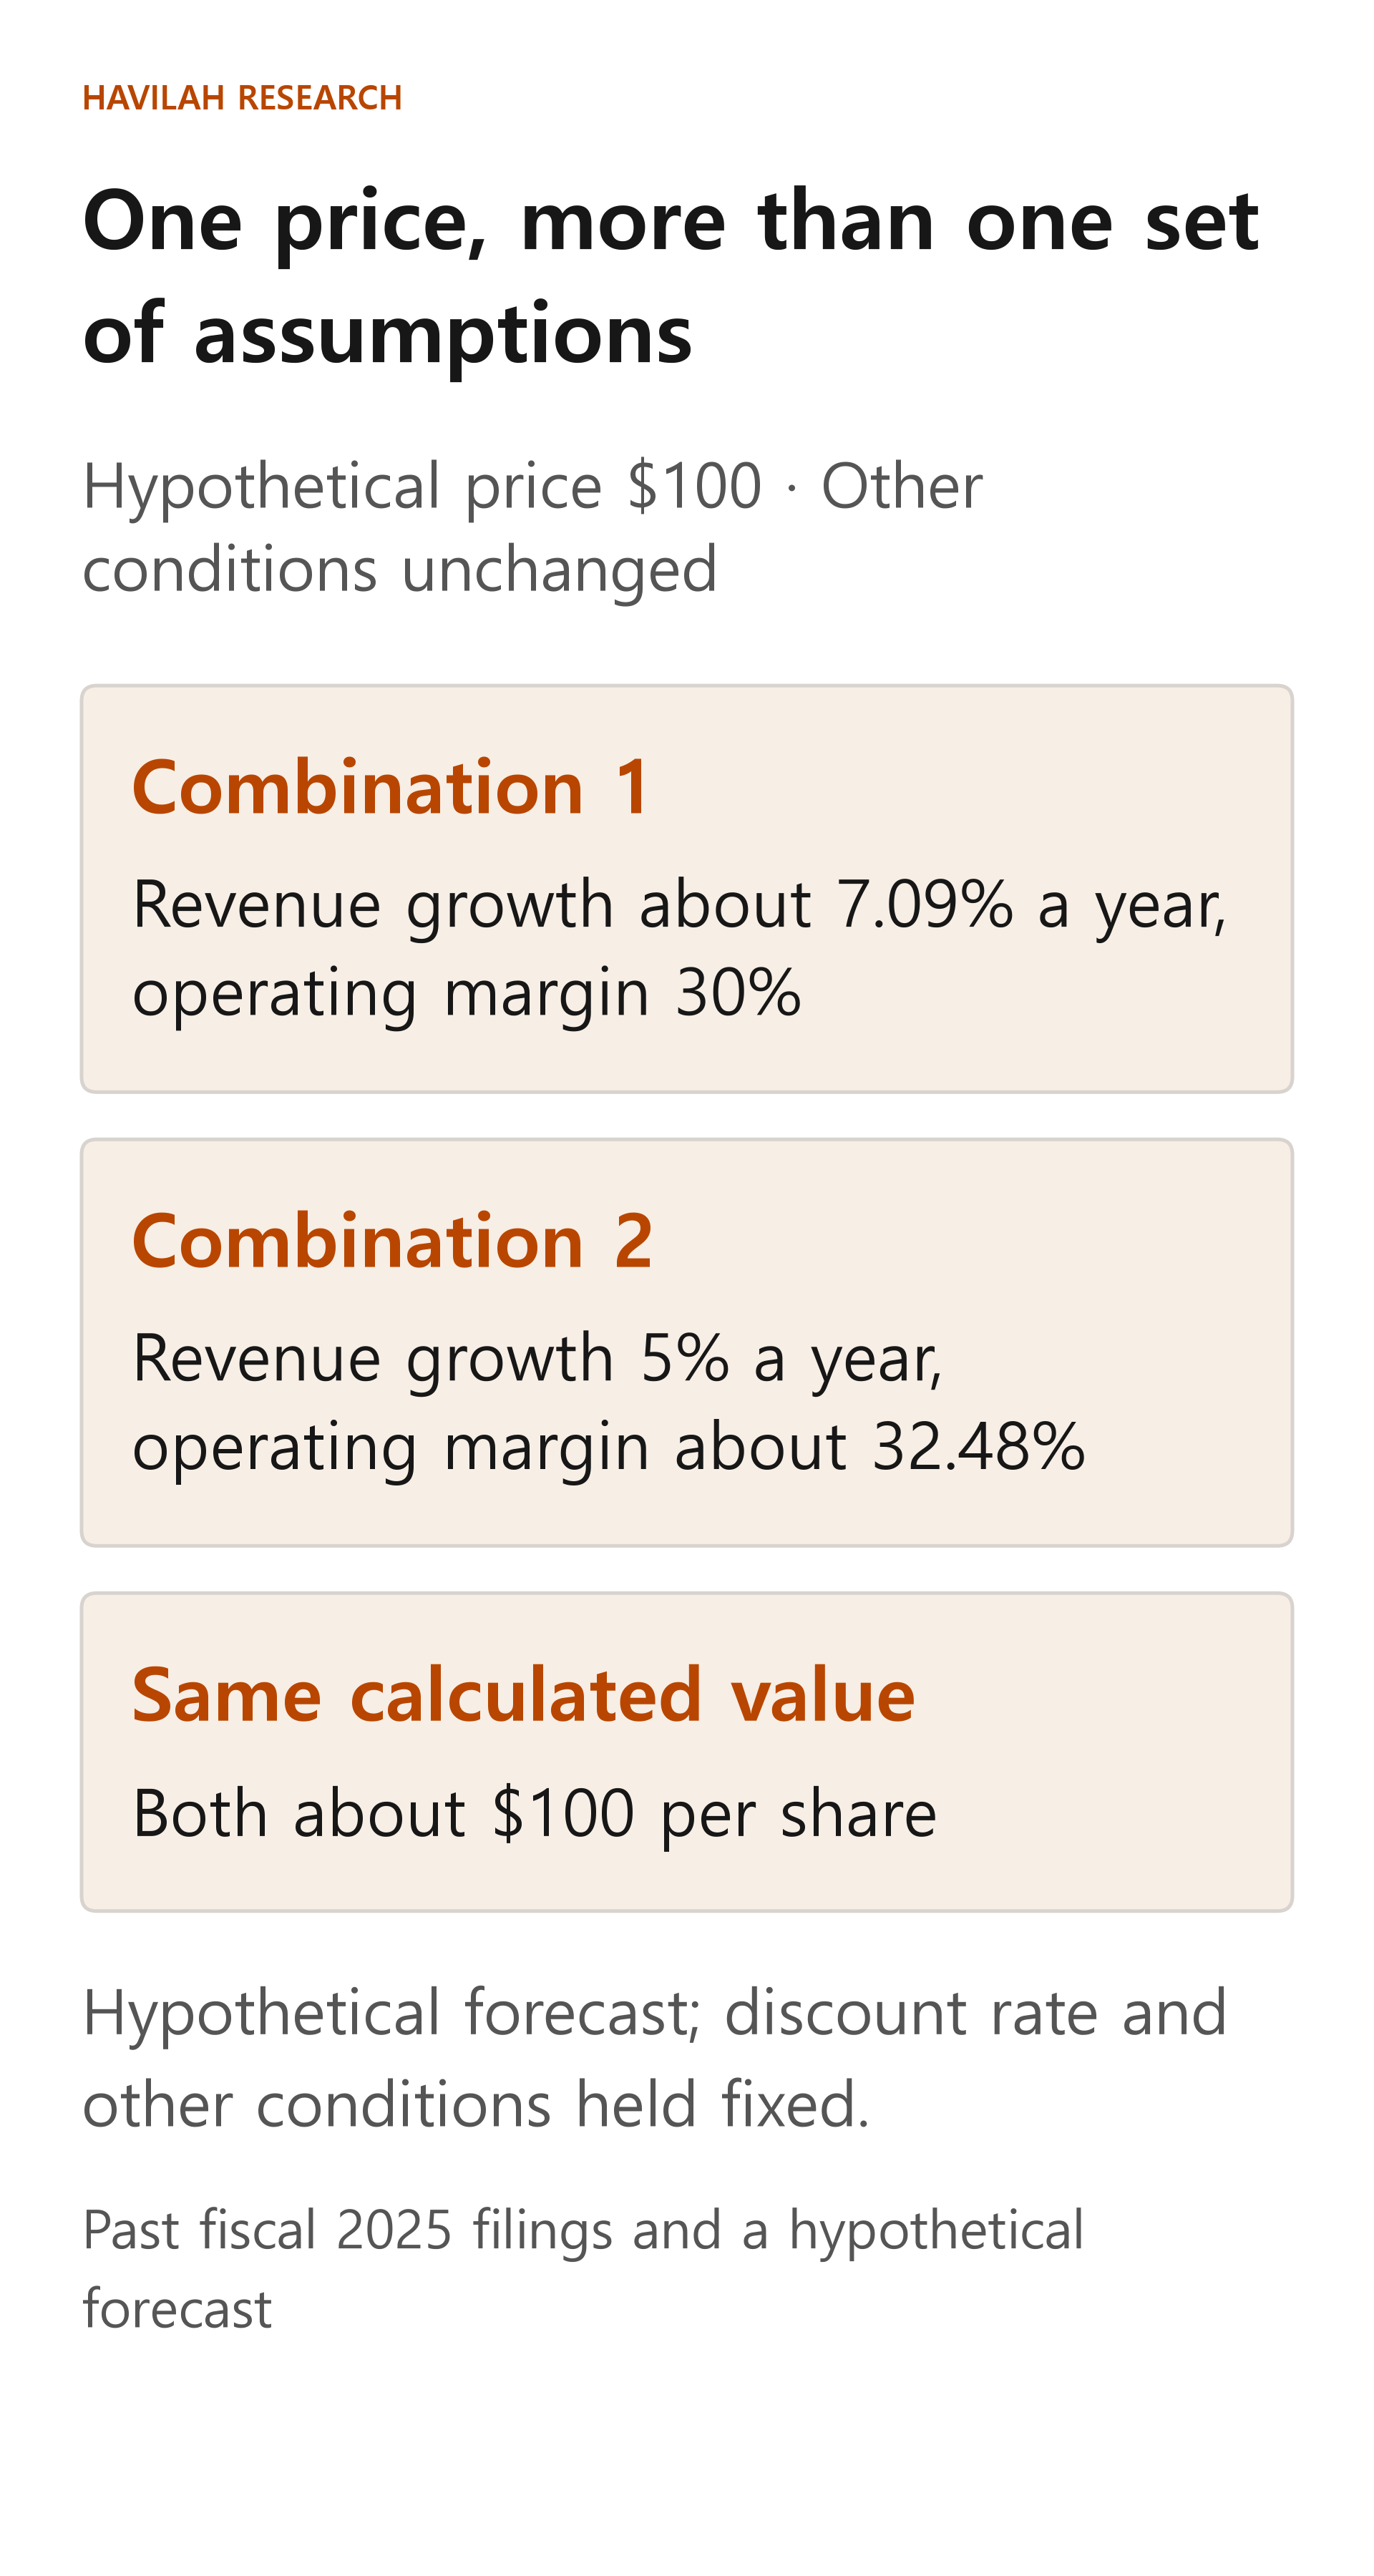
Instead of keeping revenue growth at 5%, you could adjust the operating margin. With the other assumptions the same, setting the margin at about 32.48% also gives a calculated value of about $100.00.
One combination is about 7.09% revenue growth for 5 years with a 30% margin; the other is 5% growth with a margin of about 32.48%. In this calculation, both come close to the hypothetical price.
If you also change the discount rate, capital expenditure, working capital or the long-term growth rate, you get still other combinations. So you cannot say that a reverse DCF reads the thinking of all investors as a single number. The result depends on the other assumptions you held fixed and on how the calculation is done.
Check whether the numbers you found are possible
Once you have worked out the implied growth rate, look at whether those conditions are achievable before you rush to buy or sell. Check whether the market is large enough for revenue to grow, whether competitors are increasing, and whether price increases or more customers would be needed.
If the margin has to rise, also think about which costs would have to fall or which products would need to make up a larger share. If growth requires more equipment and inventory but you left investment spending unchanged, the calculation may be too optimistic.
The same number can mean different things under different conditions. Lowering the discount rate changes the growth rate needed, and an increase in the future number of shares also changes the calculated value per share. Besides a company's results, changes in interest rates and in the returns investors require can also drive share prices.
How to use a reverse DCF in investing
First, in a real analysis, match the dates of the share price and the filings, and check the latest cash, debt and share count. Second, decide which conditions to hold fixed and what to solve for. Third, compare the result with the company's past results and its business environment.
If the implied conditions look higher than what you expect, you can consider the possibility that the price already reflects an optimistic outcome to some degree. However, there may be other assumptions or other investors' judgments, so this does not automatically lead to the conclusion that the stock is expensive.
Key points to remember
A reverse DCF starts from the price and looks for the assumptions that explain it. More than one combination of growth rate and margin can produce the same share price.
More important than the calculated result is how those assumptions could come true in the actual business, and what loss you could accept if they turn out wrong. In the next lesson, we will look at converting enterprise value into value per share and setting conditions for buying and selling.