
Even when investors forecast the same future cash for the same company, the share values they calculate can differ. One of the reasons is the discount rate.
The discount rate is the rate you use to convert money you will receive in the future into today's value. If you see the future as more uncertain, or the return you require goes up, you may put a lower present value on the same future cash.
How do small differences add up?
Suppose you will receive $100 in 1 year. At an annual discount rate of 9%, today's value is 100 ÷ 1.09, or about $91.74. At a discount rate of 10%, it is 100 ÷ 1.10, or about $90.91. At 11%, it is about $90.09.
Going from 10% to 11% is a change of 1 percentage point. Do not confuse this with the relative increase of 10% measured from the 10% starting point.
The difference over 1 year may look small, but cash far in the future is discounted over many years. And when you calculate a terminal value with a constant-growth assumption, the gap between the discount rate and the long-term growth rate goes into the denominator. For these reasons, the difference in the overall result can become larger.
Revisiting the previous lesson's workbook
In Lesson 131, you built an educational DCF workbook starting from Apple's fiscal 2025 results. The forecast, including revenue growth of 5%, an operating margin of 30%, an assumed tax rate of 20% and a long-term growth rate of 2%, consisted of illustrative assumptions, not actual results. The workbook also simplified things, for example by adding all cash and marketable securities and subtracting some debt at book value.
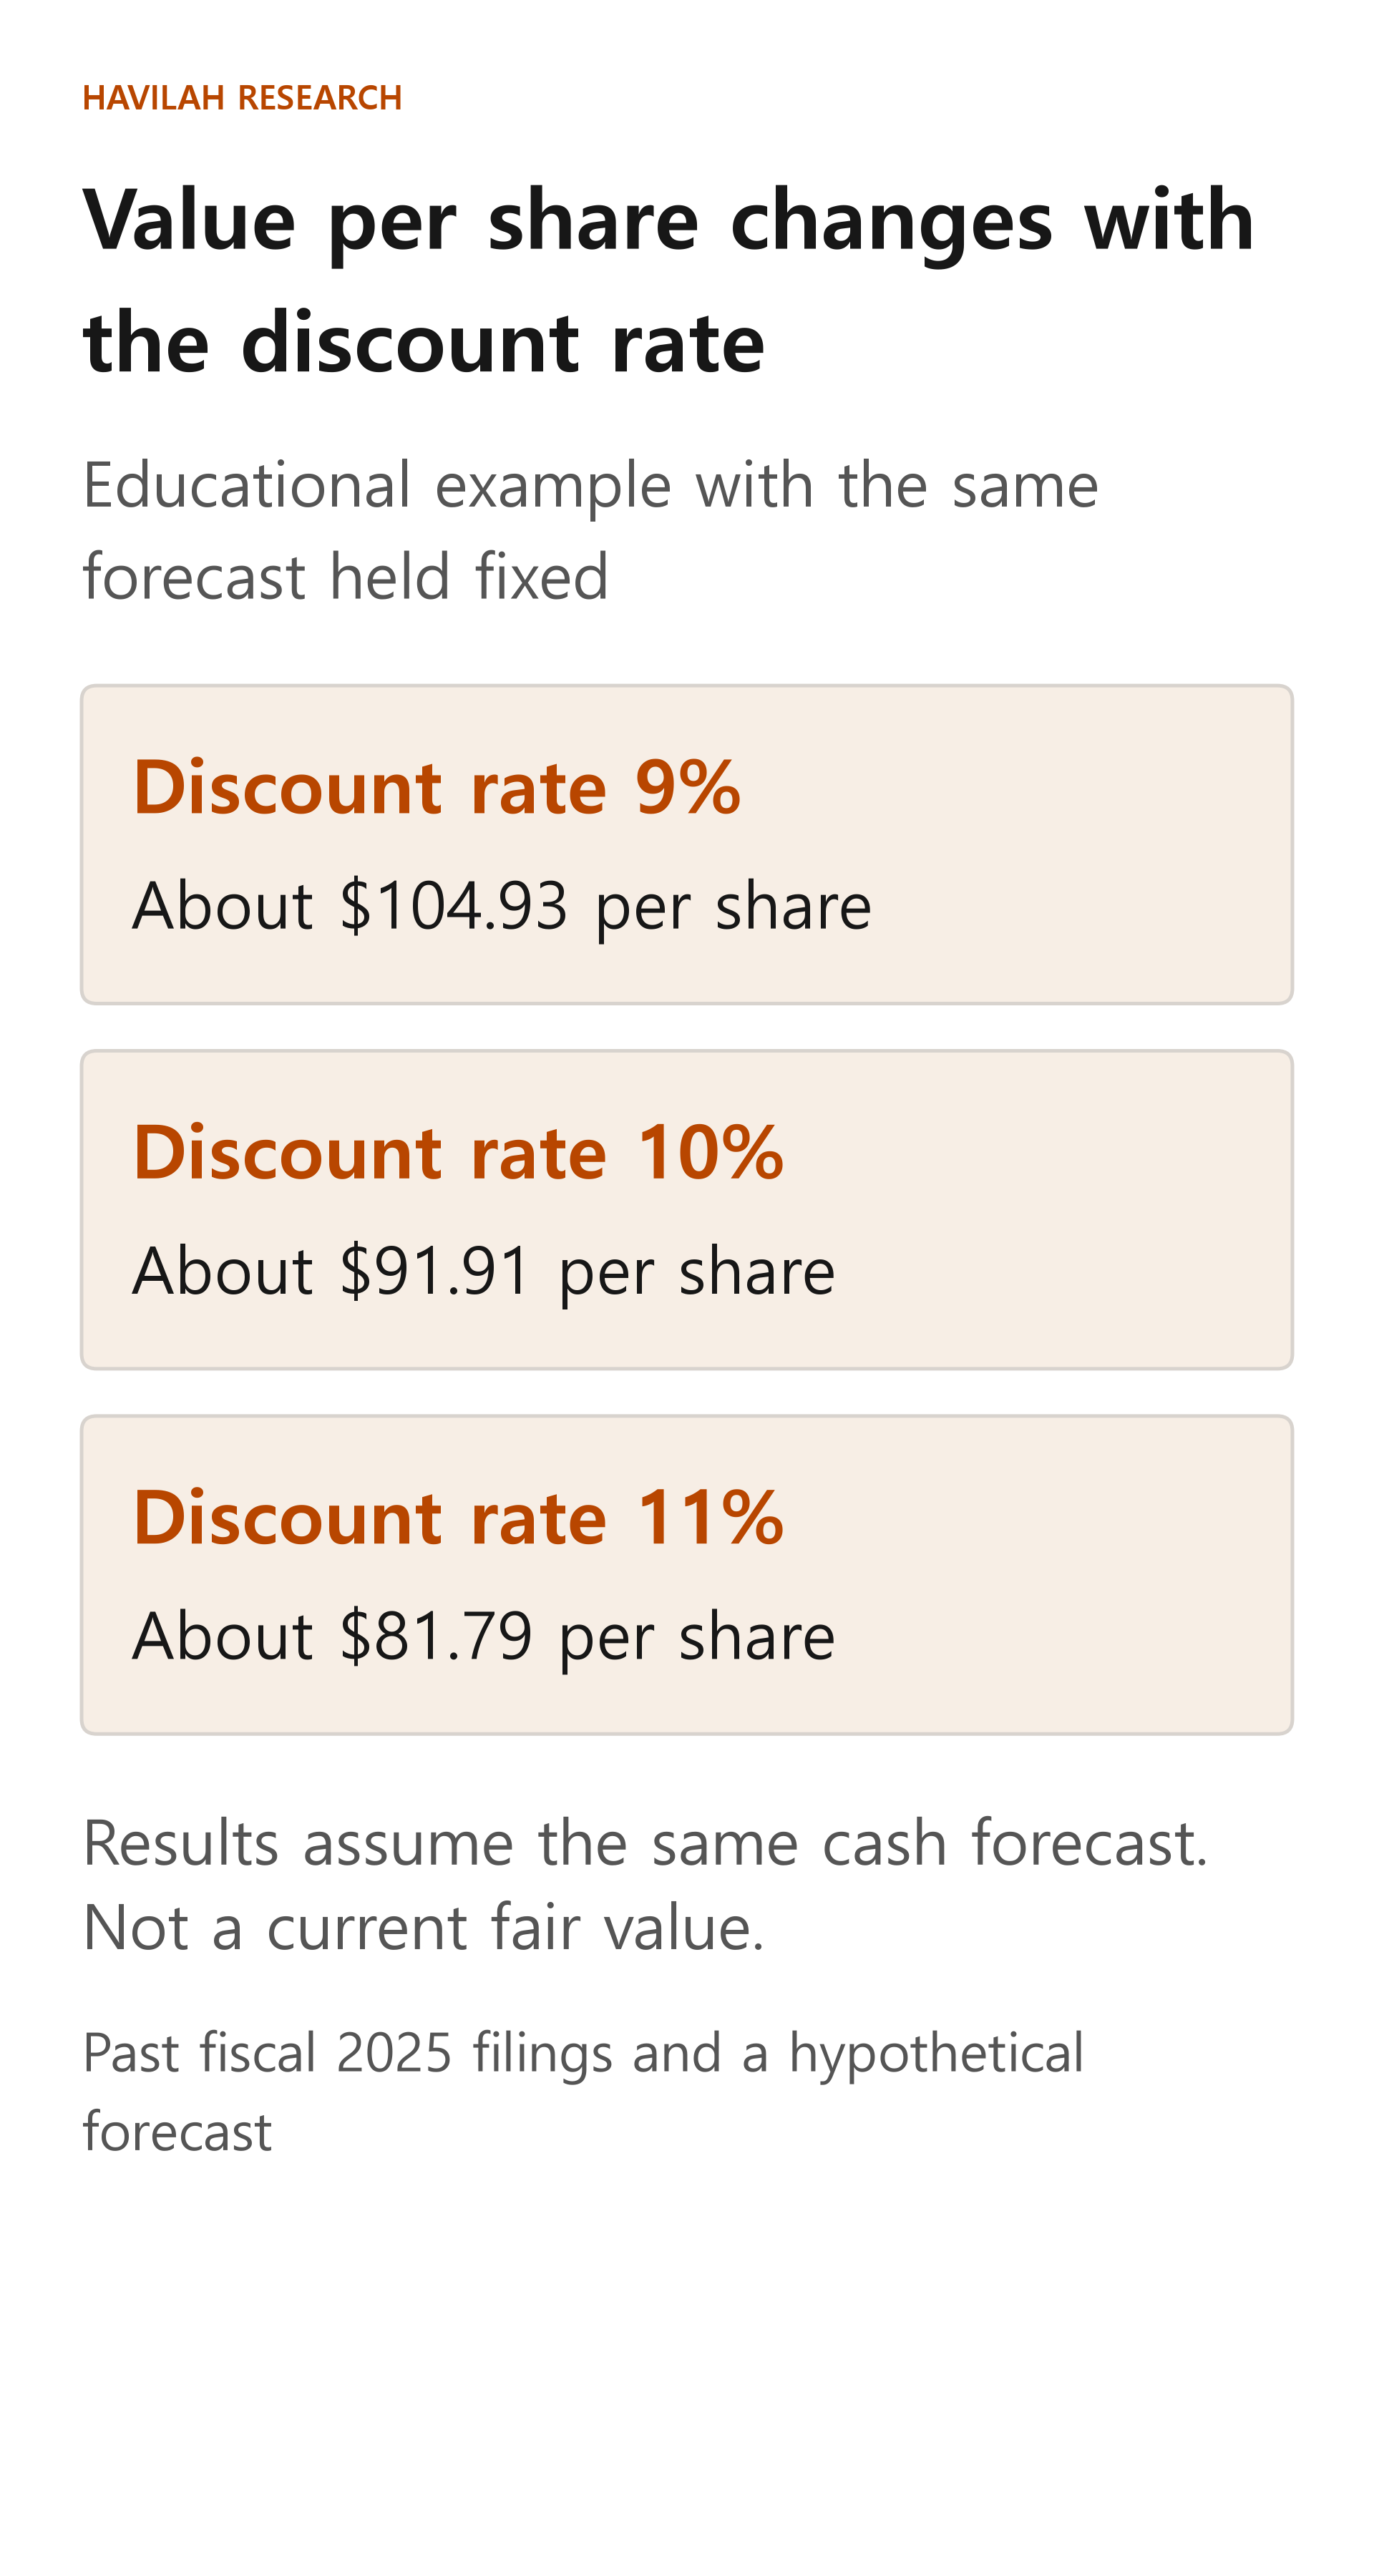
If you keep that hypothetical forecast and every other condition the same, and change only the discount rate applied to the 5 years and to the terminal value, you get the following.
| Discount rate | Calculated value per share (USD) |
|---|---|
| 9% | About 104.93 |
| 10% | About 91.91 |
| 11% | About 81.79 |
Starting from 10%, lowering the discount rate by 1 percentage point raises the calculated value by about $13.02. Raising it by 1 percentage point lowers the value by about $10.12. The two changes are not symmetrical, either.
These figures are the result of an exercise that combines fiscal 2025 year-end data with an arbitrary forecast. They are not Apple's current share price or an actual fair value. Even for the same company, a different cash forecast or a different way of treating debt gives a different value.
Why does the terminal value change so much?
In the previous lesson, the terminal value was calculated by dividing the cash for the year after year 5 by the difference between the discount rate and the long-term growth rate. With the long-term growth rate fixed at 2%, the denominator is 7%, 8% and 9% for discount rates of 9%, 10% and 11%.
The higher the discount rate, the larger the denominator, and the smaller the terminal value at year 5. On top of that, the discounting that brings that amount back to today is applied more heavily. In other words, a change in the discount rate affects both the terminal value calculation and the present value calculation.
In this formula, the discount rate must be higher than the long-term growth rate. As the two get closer, the result grows sharply, so do not read small differences as if they were precise predictions.
How do sensitivity and scenarios differ?
Holding the other conditions fixed and changing only the discount rate, as in the table above, is called sensitivity analysis. It is a good way to see which assumptions have a big effect on the result. But it does not mean that only one condition changes in reality.
In scenario analysis, you can look at several related assumptions as a set. For example, applying revenue growth of 4%, an operating margin of 27% and a discount rate of 11% together gives about $70.27. Applying revenue growth of 6%, an operating margin of 33% and a discount rate of 9% together gives about $121.03. All other conditions are the same as in the previous lesson.
These, too, are hypothetical combinations meant to help you understand the possibilities. They do not mean the actual value must fall between the two numbers, or that each result is equally likely. You need to explain separately whether there is a reason for slower revenue growth and lower margins to appear together, and how much you would adjust the discount rate if risk increased.
Questions for investors to check
Before you change the discount rate in the workbook, check which cash the number is applied to. Match the company's cost of capital to cash left for the whole company, and the return shareholders require to cash left only for shareholders.
A 1-percentage-point move in interest rates does not automatically change every company's discount rate by the same amount. The company's debt structure, the return shareholders require and the business risk can all play a part. Also check that you are not counting the same risk twice, in both the cash forecast and the discount rate.
Finally, rather than a single number, write down the conditions under which your judgment would change. That means checking whether your view of the company still holds if the expected margin is a little lower, and whether you have reflected situations that require larger investment.
Key points to remember
If you assume the same cash, the higher the discount rate, the lower the present value of that cash. In a model where the terminal value is large, differences in the discount rate can have a big effect on the overall result.
The range of calculated values is the range of the assumptions you chose. It does not mean the uncertainty has gone away. In the next lesson, we will work the other way: start from the share price and see what forecast it requires.