
If a company's revenue grows, does the value of its shares always rise? Not necessarily. Even when revenue grows, if margins shrink or investment takes more money, the value left for shareholders can be smaller than you expected.
A tool for seeing these relationships at a glance is discounted cash flow, or DCF. It estimates the cash the business will produce in the future and converts it into today's value. This time, we will start from an actual filing but make our own assumptions about the future to build a spreadsheet.
Keep the actual numbers separate from the hypothetical forecast
Apple's revenue for fiscal 2025 was $416,161 million, and its operating income was $133,050 million. The fiscal year ended on September 27, 2025. These two are past figures the company reported in its filings.
How much revenue will grow and how much profit will remain in the future is not yet known. To help you follow the calculation below, we assume the same revenue growth rate of 5%, operating margin of 30% and tax rate of 20% every year. These are not Apple's actual outlook or anything the company has announced.
All amounts are in USD millions. This example is an exercise using data as of the fiscal 2025 year-end, and it does not reflect the current share price or the company's current financial position.
From revenue to the cash left over
Revenue in the first year is 416,161 × 1.05 = $436,969.05 million. Multiplying it by the 30% operating margin gives operating income of $131,090.72 million. Applying the assumed 20% tax rate to this amount gives after-tax operating income of $104,872.57 million.
But profit is not the same as cash. Depreciation spreads the cost of past investments over time in the accounts; it is not an expense that sends that much new cash out of the company this year. On the other hand, money spent on equipment and additional working capital tied up in the business reduce cash.
To keep the calculation simple, assume depreciation is 3% of revenue, capital expenditure 4% and the increase in working capital 1%. Working capital increases when, for example, more money gets tied up in inventory and in sales made on credit. At a real company, you would need to break these items down in more detail.
| First-year item | Amount (USD millions) |
|---|---|
| After-tax operating income | 104,872.57 |
| Plus depreciation | 13,109.07 |
| Minus capital expenditure | 17,478.76 |
| Minus increase in working capital | 4,369.69 |
| Free cash flow to the firm | 96,133.19 |
This free cash flow to the firm is an estimate of the cash from the business that could go to lenders and shareholders. It was calculated from unrounded amounts.
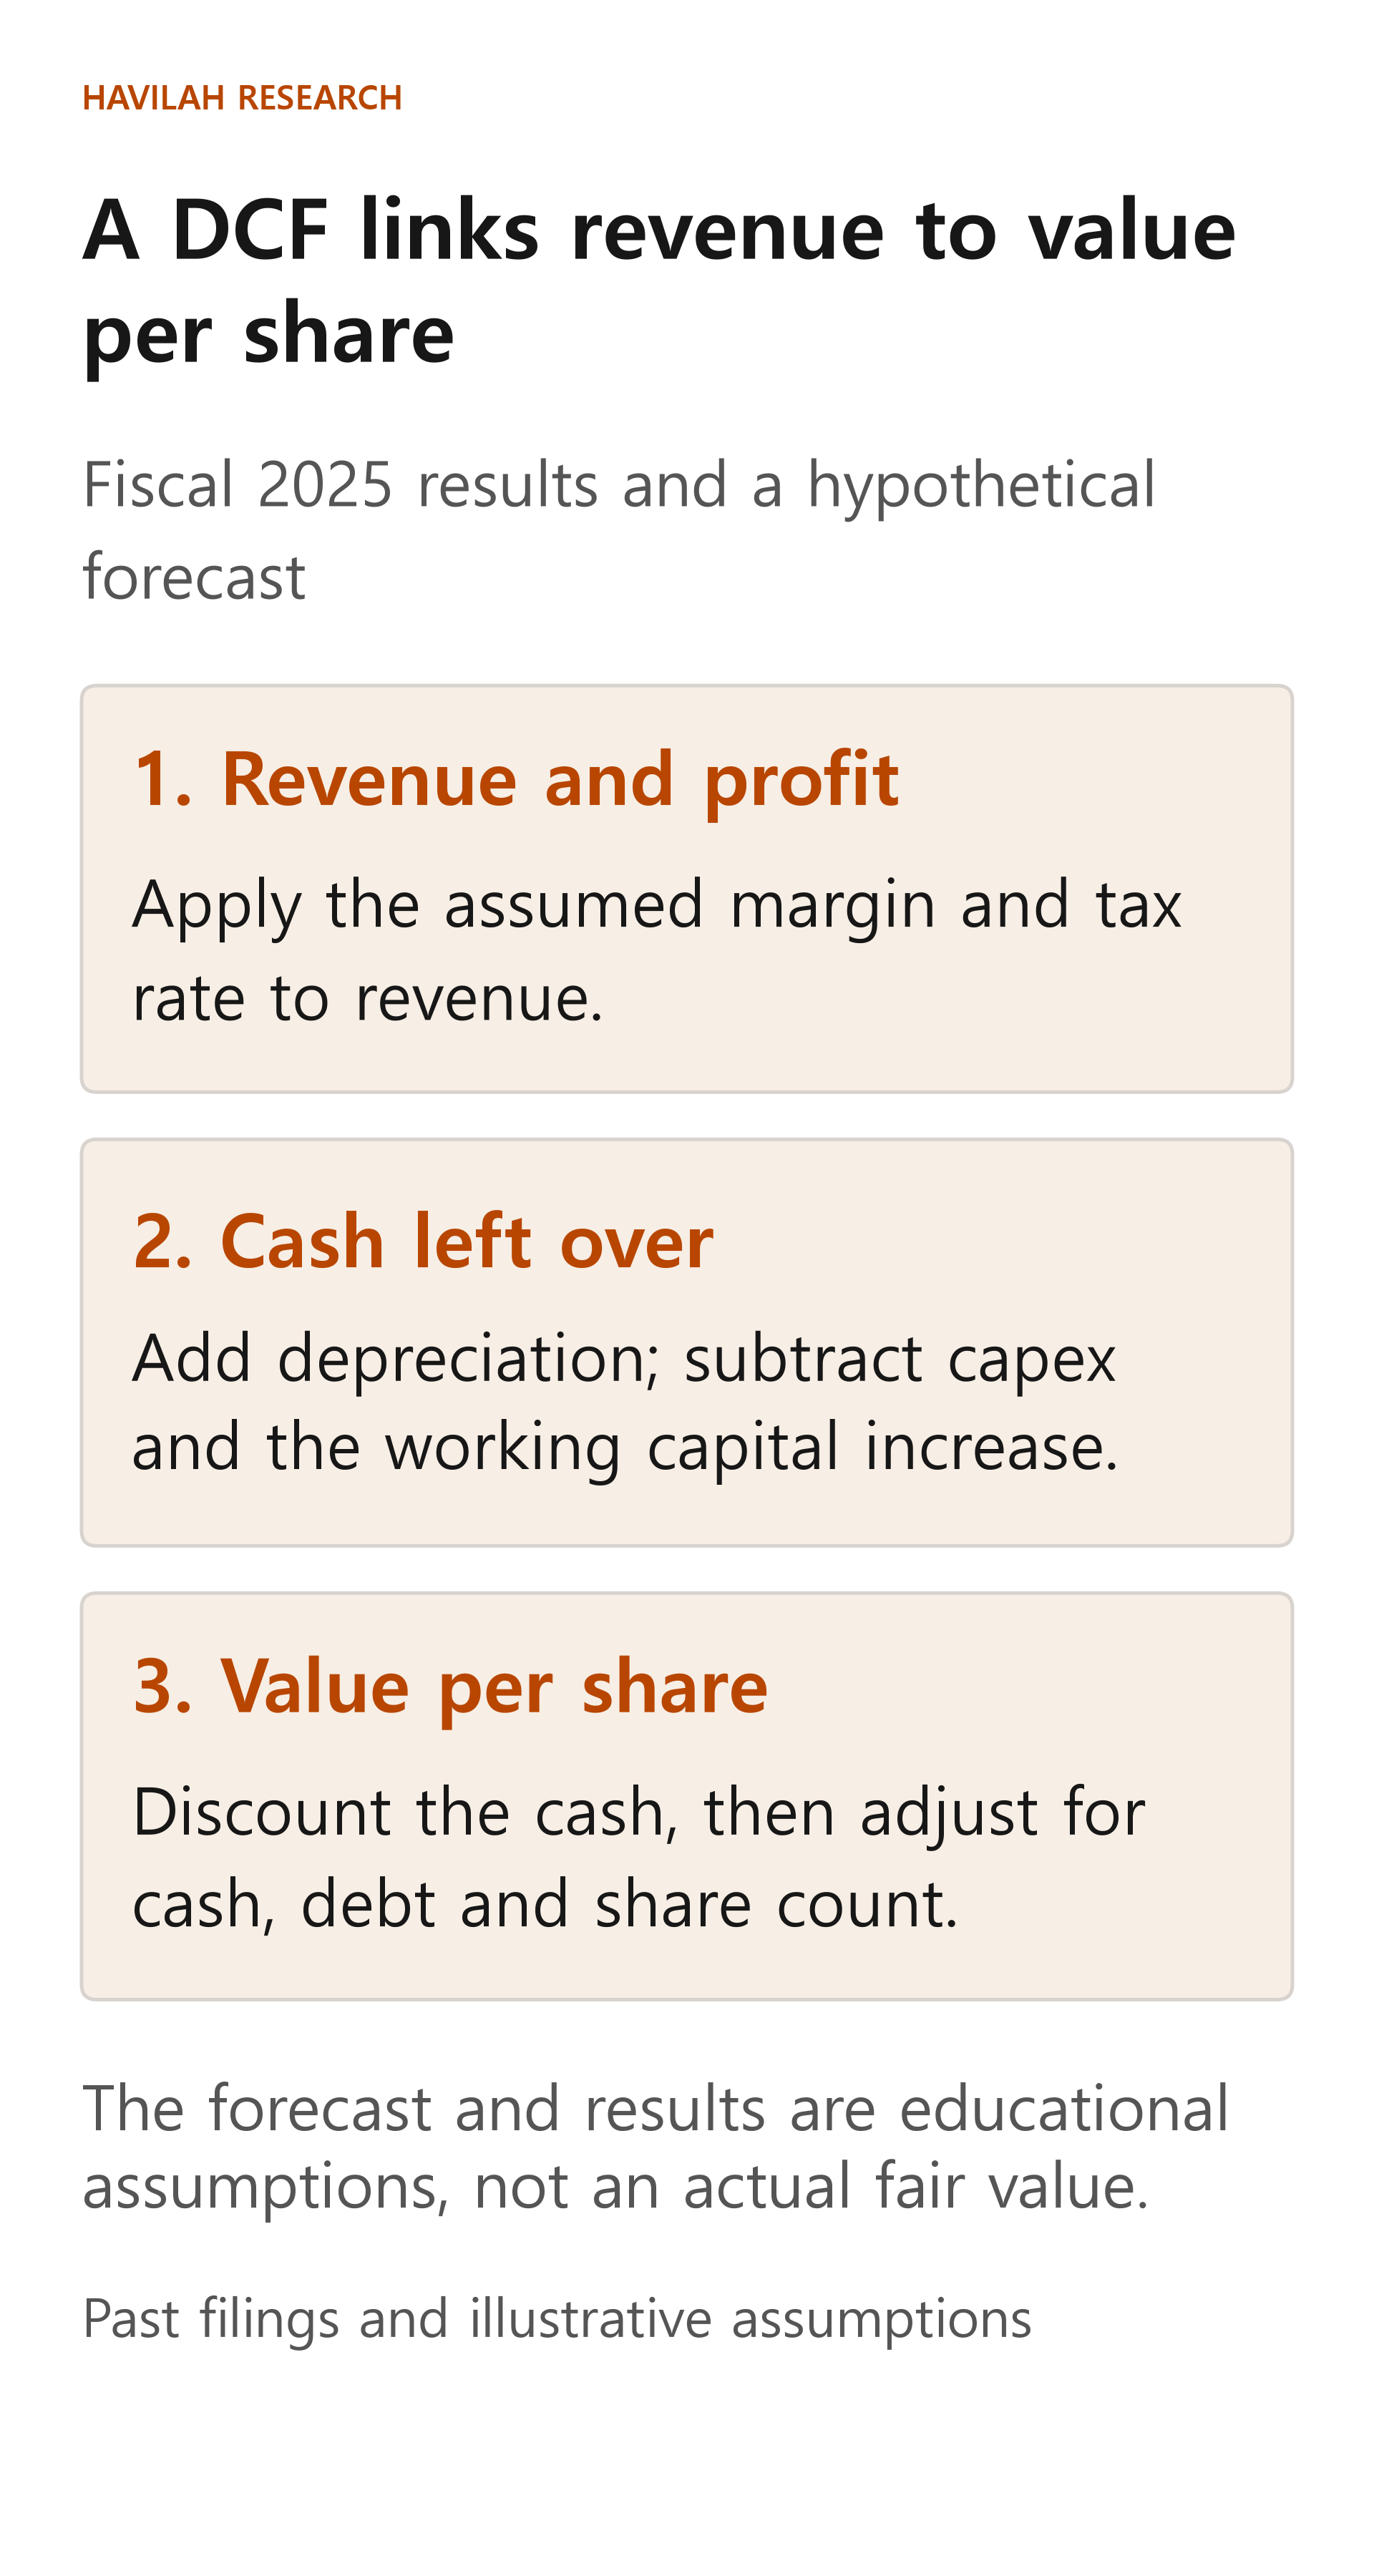
5 years of cash and the value after that
Apply the same assumptions for 5 years, and convert the cash at the end of each year into present value with a discount rate of 10% a year. After year 5, assume the cash grows steadily by 2% a year and calculate the terminal value. This includes the simple assumption that the reinvestment needed for that growth is already reflected in the cash estimates.
The present value of the 5 years of cash is about $399,009.58 million, and the present value of the terminal value is about $925,075.79 million. Added together, they give an enterprise value of about $1,324,085.37 million.
This does not mean the business ends after 5 years. The terminal value contains the cash from year 6 onward. In this example, a large part of the total value depends on assumptions about the distant future, so you should try changing the growth rate and the discount rate together.
From enterprise value to value per share
Enterprise value does not belong to shareholders alone. In this simple example, you add the $132,420 million of cash and marketable securities at the end of fiscal 2025 and subtract the $98,657 million book value of short- and long-term debt. The result is an equity value of about $1,357,848.37 million.
Dividing this by the approximately 14,773.26 million shares outstanding on the same balance-sheet date gives about $91.91 per share. This is only an educational number calculated with set assumptions. It is not a fair value or a signal to buy or sell.
In a real analysis, you need to look separately at how much of the cash the business needs, the market value of debt, leases and other claims, and dilution from stock-based compensation. Here, all of the cash and marketable securities were added, and some of the debt was simply taken at book value, so this is not a precise valuation.
Try changing the workbook yourself
The blue numbers in the workbook are inputs you can change. If you change "Assumed revenue growth rate" from 5% to 4% and leave the other assumptions as they are, "Calculated value per share (USD)" changes from about $91.91 to about $88.25. In other words, when the assumptions change, the result changes.
You can also work the other way: set a hypothetical share price of $100, keep the other assumptions, and adjust "Assumed revenue growth rate". In this simple model, entering about 7.09% a year for the 5 years brings "Calculated value per share (USD)" close to $100. You can think of this as working backward to look at the expectations built into a price. It does not mean the actual market expects exactly that growth rate.
The terminal value formula can be used only when the discount rate is higher than the long-term growth rate. Also, if you raise only the growth rate and do not change the investment that growth requires, the result can be too optimistic. When you apply this to a real investment, check the past filings, compare several combinations of assumptions, and then recalculate with the latest data.
Key points to remember
A DCF is a calculation that starts from revenue and runs through profit, reinvestment and cash to present value. Reported results are a past you can check; a forecast is an assumption that can be wrong.
What matters more than the number the workbook shows is the assumptions that produced it. In the next lesson, we will look at the range of values you get when the assumptions change.