
If a company sells more products, does its revenue always grow just as much? Not necessarily. Even if sales volume rises, revenue may grow less than you expect if the company has cut its prices sharply.
When you forecast a company's revenue, it helps to look separately at how many units it can sell and how much it actually receives for each one.
Split revenue into sales volume and the actual selling price
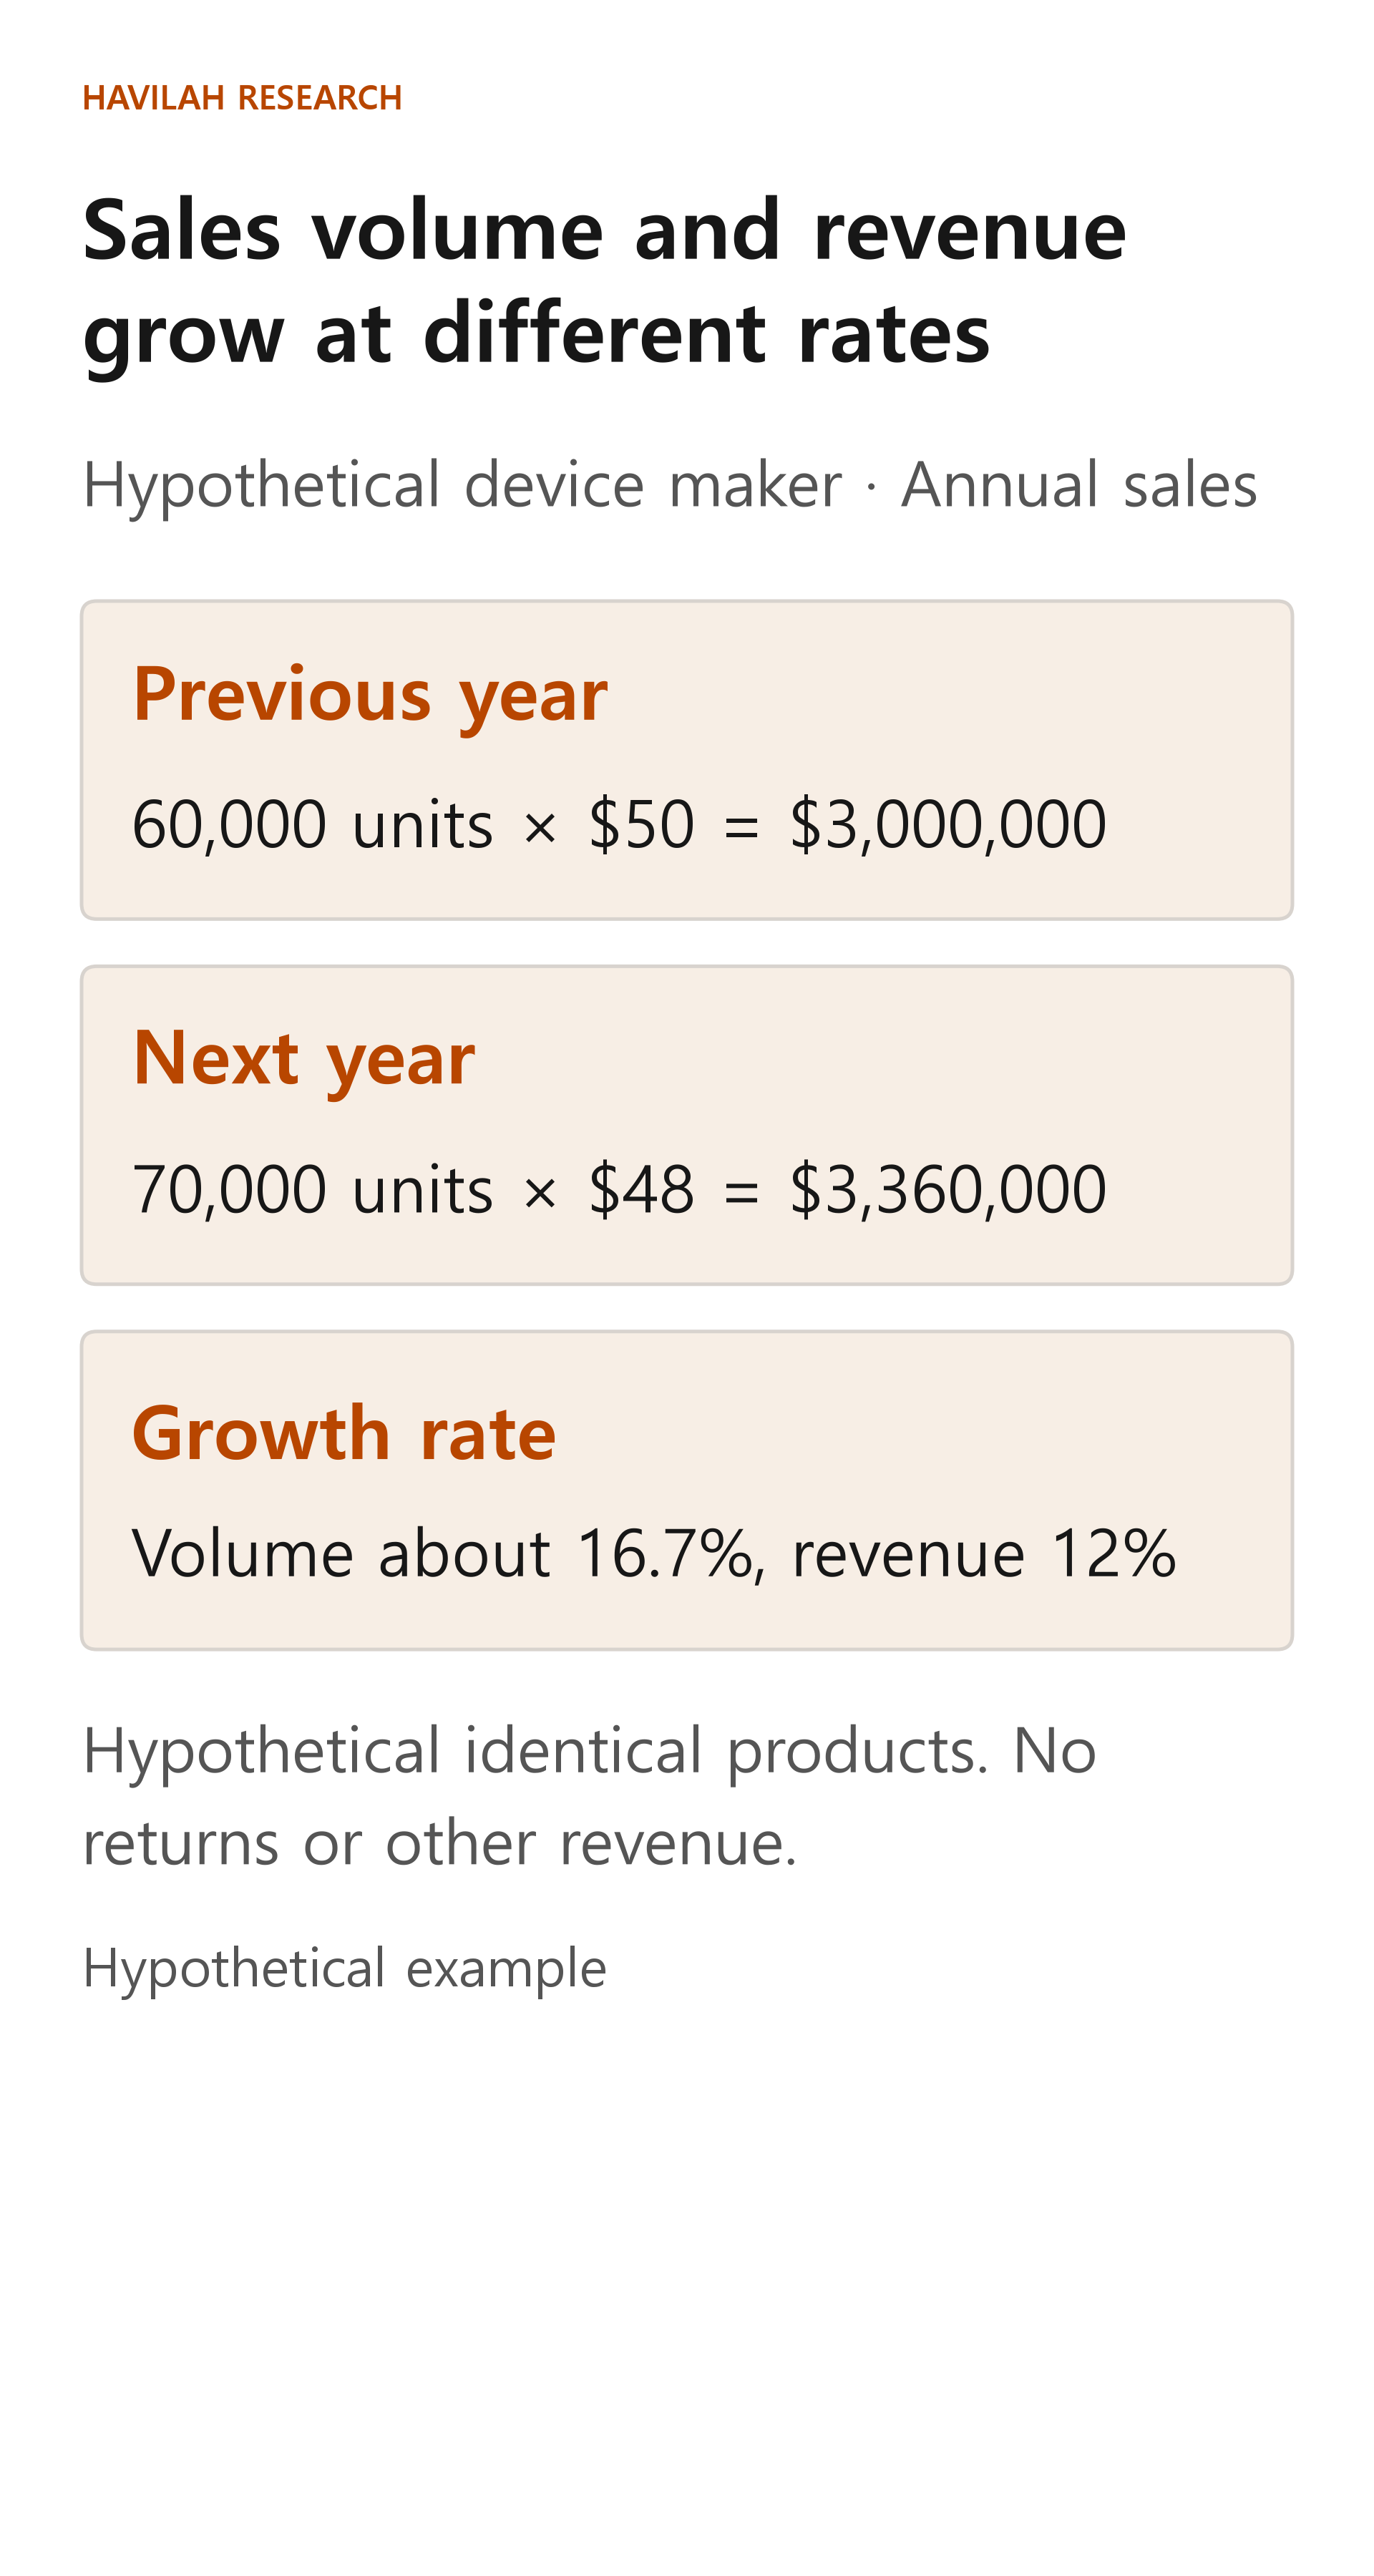
Suppose a hypothetical device maker sold 60,000 units in a year at an average price of $50 each. If every unit is sold on the same terms and there are no returns or other revenue, revenue is 60,000 units × $50 = $3,000,000.
Now suppose that the next year, sales volume rises to 70,000 units, but the average selling price falls to $48. Revenue is then 70,000 units × $48 = $3,360,000. That is $360,000, or 12%, more than the year before. Sales volume grew by 10,000 units ÷ 60,000 units, or about 16.7%, but because the price fell, revenue grew by less than that.
Why the price fell also matters. The company may have discounted the same product, or more of its cheaper products may have sold, pulling the overall average down. The company-wide average alone cannot tell you which it was, so check whether the company discloses sales volume and prices by product.
Look at the price actually received, not the list price
The list price on a product is not necessarily the price that goes into the revenue calculation. Volume discounts, returns and price adjustments under contracts can all affect revenue.
For example, if the company above had sold all 70,000 units at $50, its revenue would have been $3,500,000. Assuming the actual average is $48, revenue is $3,360,000, a difference of $140,000. This hypothetical calculation keeps sales volume the same and shows only the effect of the price difference.
For a real company, when revenue is recognized (recorded in the accounts) and how much is recognized can depend on the terms of each contract. Receiving an order does not by itself make it that year's revenue. Check in the company's filings when products are handed over to customers and on what basis the company records revenue.
What a company can make is not the same as what it can sell
A factory's production capacity is the quantity of products it can make in a given period. The utilization rate shows how much of that capacity is being used. If capacity is 100,000 units a year and the utilization rate is 70%, the factory in this simple example produces 70,000 units.
But being able to make 70,000 units does not mean all of them will be sold. If demand falls short or deliveries to customers are delayed, sales volume will differ. On the other hand, if the company sells inventory it made earlier, its sales volume for the year can be higher than its production.
The table below is a hypothetical case in which inventory does not change and everything produced is sold in the same year, meeting the conditions for recognizing revenue. Production capacity stays at 100,000 units every year.
| Item | Forecast year 1 | Forecast year 2 | Forecast year 3 |
|---|---|---|---|
| Utilization rate | 60% | 70% | 80% |
| Units produced and sold | 60,000 | 70,000 | 80,000 |
| Average selling price | $50 | $48 | $45 |
| Forecast revenue | $3,000,000 | $3,360,000 | $3,600,000 |
Revenue in year 3 is 80,000 units × $45 = $3,600,000. This table only illustrates how to calculate revenue. It does not show the profit left after production costs or capital spending. Running the factory at a higher utilization rate can require extra costs, so look at revenue and profit separately.
Adapt the calculation to the business
Not every company can be analyzed with factory utilization rates. Some, like the subscription service in Lesson 117, depend on the number of customers and the fee they pay. For other services, revenue depends on how much customers use them.
If a company charges by usage, suppose its hypothetical customers use the service for a total of 2,000 hours a month and the rate is $3 an hour. Revenue is then $6,000. Here, too, we assume there are no discounts or free usage, and that all the service for the period has been provided, so the conditions for recognizing revenue are met.
Whatever the business, the key is the same: find out what the company is paid for, and forecast that quantity and the actual price separately. If the information is not disclosed, leave the parts you cannot verify open rather than inventing precise numbers.
Applying this to a real company
Start by reading what the company's filings say about revenue by business segment, sales volume and changes in prices. Also check how the company defines the production capacity and utilization figures it provides. If the company does not disclose quantities, a simple average price you work out by dividing revenue may differ from the actual prices of individual products.
Next, write down why sales volume and price might each change. Customer orders may grow while production cannot keep up, or the company may have to offer discounts to sell more. If you change price or volume one at a time, you can also see which assumption revenue is most sensitive to.
A revenue forecast is the starting point for an investment decision. You also need to look at the costs of producing that revenue and the investment it requires before you can judge how much the company actually keeps.