
Suppose two companies both belong to the semiconductor industry. One runs its own factories, while the other focuses on design. Can you put the same price tag on both just because they share the name of an industry?
Comparison starts with finding similar companies, but it only becomes useful once you understand how they differ. If you simply take an average without knowing why the numbers differ, you can easily miss those differences too.
First, look at what each company sells
When you choose companies to compare, start with their products and customers. Costs and the investment a company needs differ depending on whether it owns its factories or has others make its products, and on whether it sells a product once or keeps charging fees for a service.
It also matters whether a company's customers are concentrated in a few businesses. Even with the same revenue, a company with a wide range of customers and long contracts and a company that depends on short-term orders from a handful of customers can carry different risks. The descriptions of products, customers and risks in the annual report (10-K) are a starting point for finding these differences.
It is hard to find a company that is exactly the same. Write down the similarities and the differences together, and for any company that is too different to compare, note down the reason.
Look at growth, margins and debt side by side
A company whose revenue is growing quickly may be expected to earn larger profits in the future. But growth may also require large costs or capital spending. Check the operating margin, cash flow and the investment needed along with the revenue growth rate.
For a company with a lot of debt, also look at the burden of interest and repayments. When accounting standards differ, the same transaction can be recorded differently in the financial statements. For example, check on what basis each company presents items such as leases and stock-based compensation expense before you compare them.
Do not put a company measured on the past year's results directly next to one measured on next year's expected results. As far as possible, line up the period of revenue and earnings, the currency, whether the figures are actual or forecast, and which adjustment items are included.
Use multiples to see a range of prices
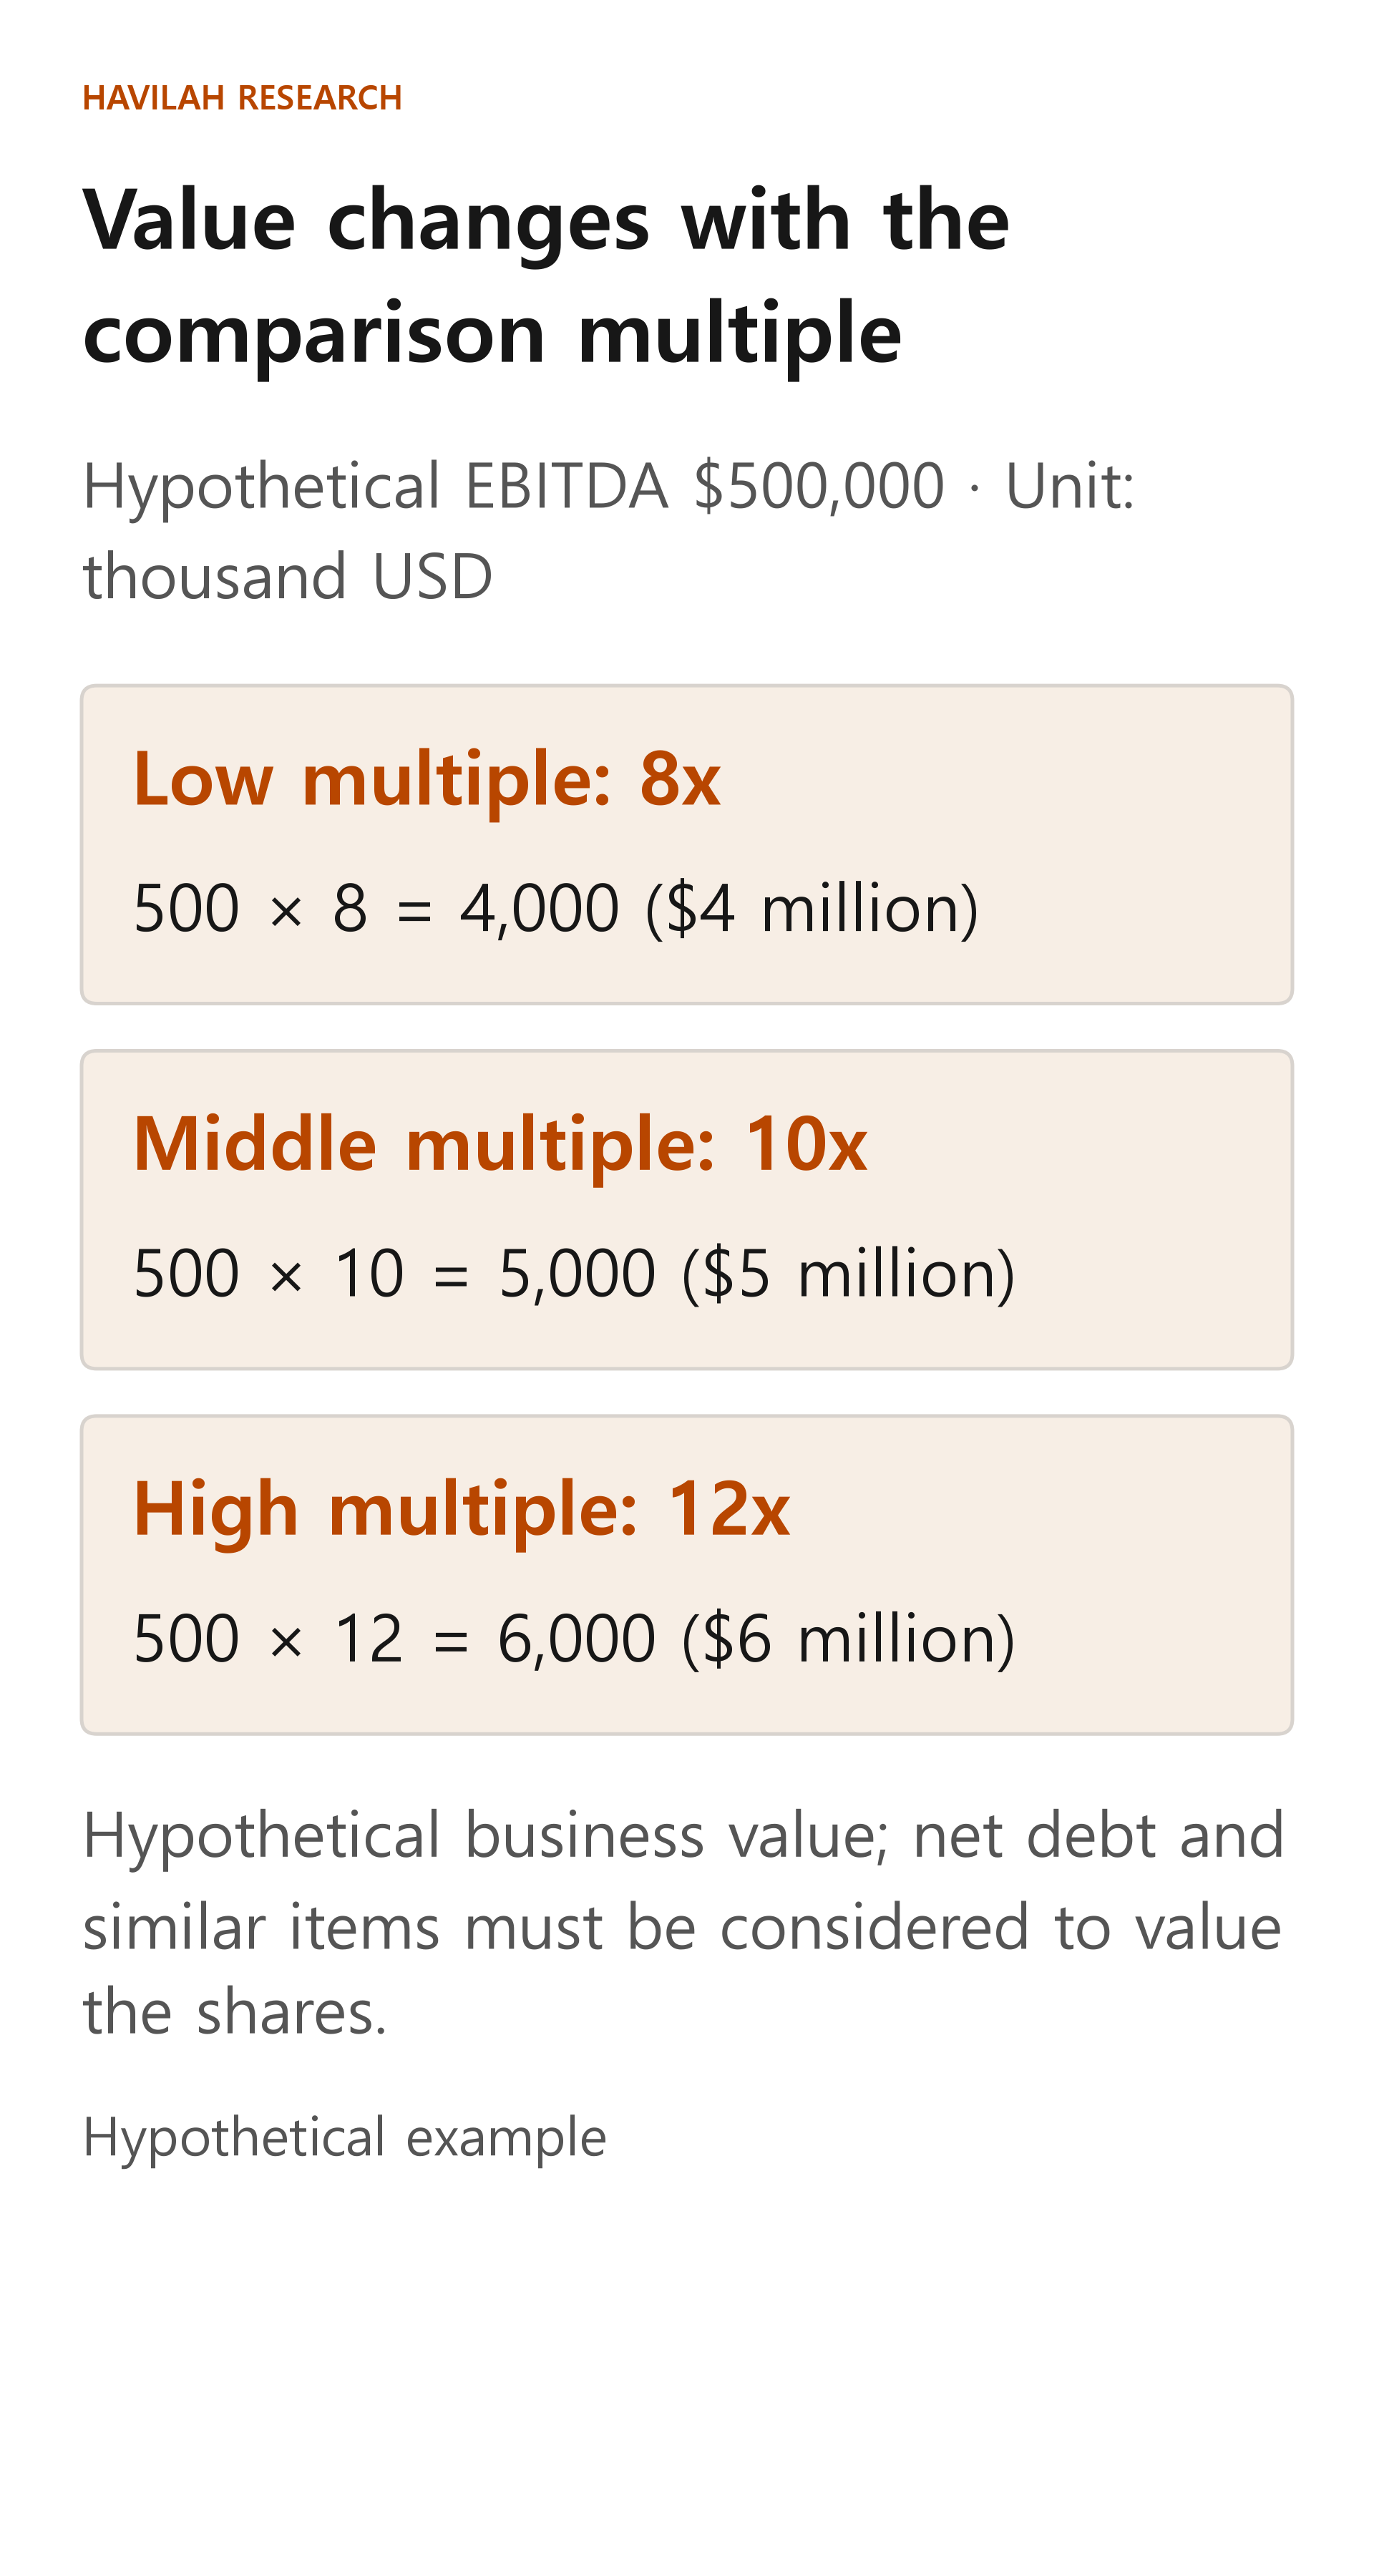
Suppose three hypothetical comparable companies have EV/EBITDA multiples of 8x, 10x and 12x. Assume they all use EBITDA for the same period and that EV has been calculated on the same basis for each. When you list them from smallest to largest, the value in the middle is 10x. This is the median of the three numbers.
If the hypothetical company you are analyzing has EBITDA of $500,000 for the same period, applying the median of 10x gives a value for the business of $500,000 × 10 = $5 million. This is the result of a calculation that uses the prices of the comparable companies, not a settled value for the company.
Applying each of the other two multiples gives $500,000 × 8 = $4 million and $500,000 × 12 = $6 million. So under these assumptions, the value of the business ranges from $4 million to $6 million. If your view of which companies are suitable for comparison or your choice of multiple changes, the result changes too.
Subtract debt when you convert to the value of the shares
Suppose the company above has net debt (its financial borrowings minus the cash it can use) of $1 million. Assume there are no preferred shares, no non-controlling interests and no other assets or liabilities to adjust for, and that the market value of the net debt equals this amount.
Subtracting the $1 million of net debt from the $5 million business value calculated with the median gives a value for the shares (equity value) of $4 million. In the same way, the low end is $4 million − $1 million = $3 million, and the high end is $6 million − $1 million = $5 million.
If you assume that 200,000 shares are currently issued and outstanding and that there is no further dilution, the value per share at the median is $4 million ÷ 200,000 = $20. The low end is $15 and the high end is $25. All three prices come from plugging a single set of hypothetical multiples, earnings and capital structure into the calculation.
Before you take the numbers at face value
The average or median of the comparable companies is only a reference point, not the right answer. Those companies may all be carrying high expectations, or conditions in their industry may be temporarily good. When there are only a few comparable companies, a single company that differs from the rest can have a large effect on the result.
If the company you are analyzing has lower growth and a heavier burden of capital spending, think again about whether it makes sense to apply the comparable companies' median as it is. On the other hand, it might have more stable revenue or higher profitability. Either way, check the evidence first, and see how much the result changes when you apply different multiples.
Comparison is not a process of copying an answer. It is a process of using the prices of similar businesses as a reference while explaining why your company should be valued the same or differently.