
A fast-growing company is not making a profit yet. When it is hard to compare it using the price-to-earnings ratio (P/E), what can you look at instead?
One way is to compare the market value of the shares with the company's revenue. But large revenue does not guarantee large profits. After you calculate the number, you also need to look at how much of that revenue the company actually keeps.
How many times revenue does it trade at?
The price-to-sales ratio (sales is another word for revenue) is called P/S. Here we calculate it by dividing market cap by one year of revenue. Market cap is the share price multiplied by the number of shares that have been issued and are outstanding.
Take hypothetical Company A and Company B. Suppose both have a market cap of $2 million and revenue of $1 million for the most recent year. Each company's P/S is $2 million ÷ $1 million = 2x. This means the market value of the shares is twice the revenue for that period.
You can calculate this ratio even when a company is not making a profit, as long as its revenue is positive. But if revenue is 0, you cannot divide by it, and revenue alone does not tell you whether the company can get out of its losses.
The same revenue can leave different amounts of money
Assume the two companies have the same revenue but different costs. Company A's net profit margin is 5% and Company B's is 20%. Net profit margin is net income (what is left after all costs and taxes) as a percentage of revenue.
Company A's net income is $1 million × 5% = $50,000. Company B's is $1 million × 20% = $200,000. If you assume that all of this net income belongs to common shareholders and that there are no other classes of shares or adjustment items, A's multiple of market cap to earnings is $2 million ÷ $50,000 = 40x, and B's is $2 million ÷ $200,000 = 10x.
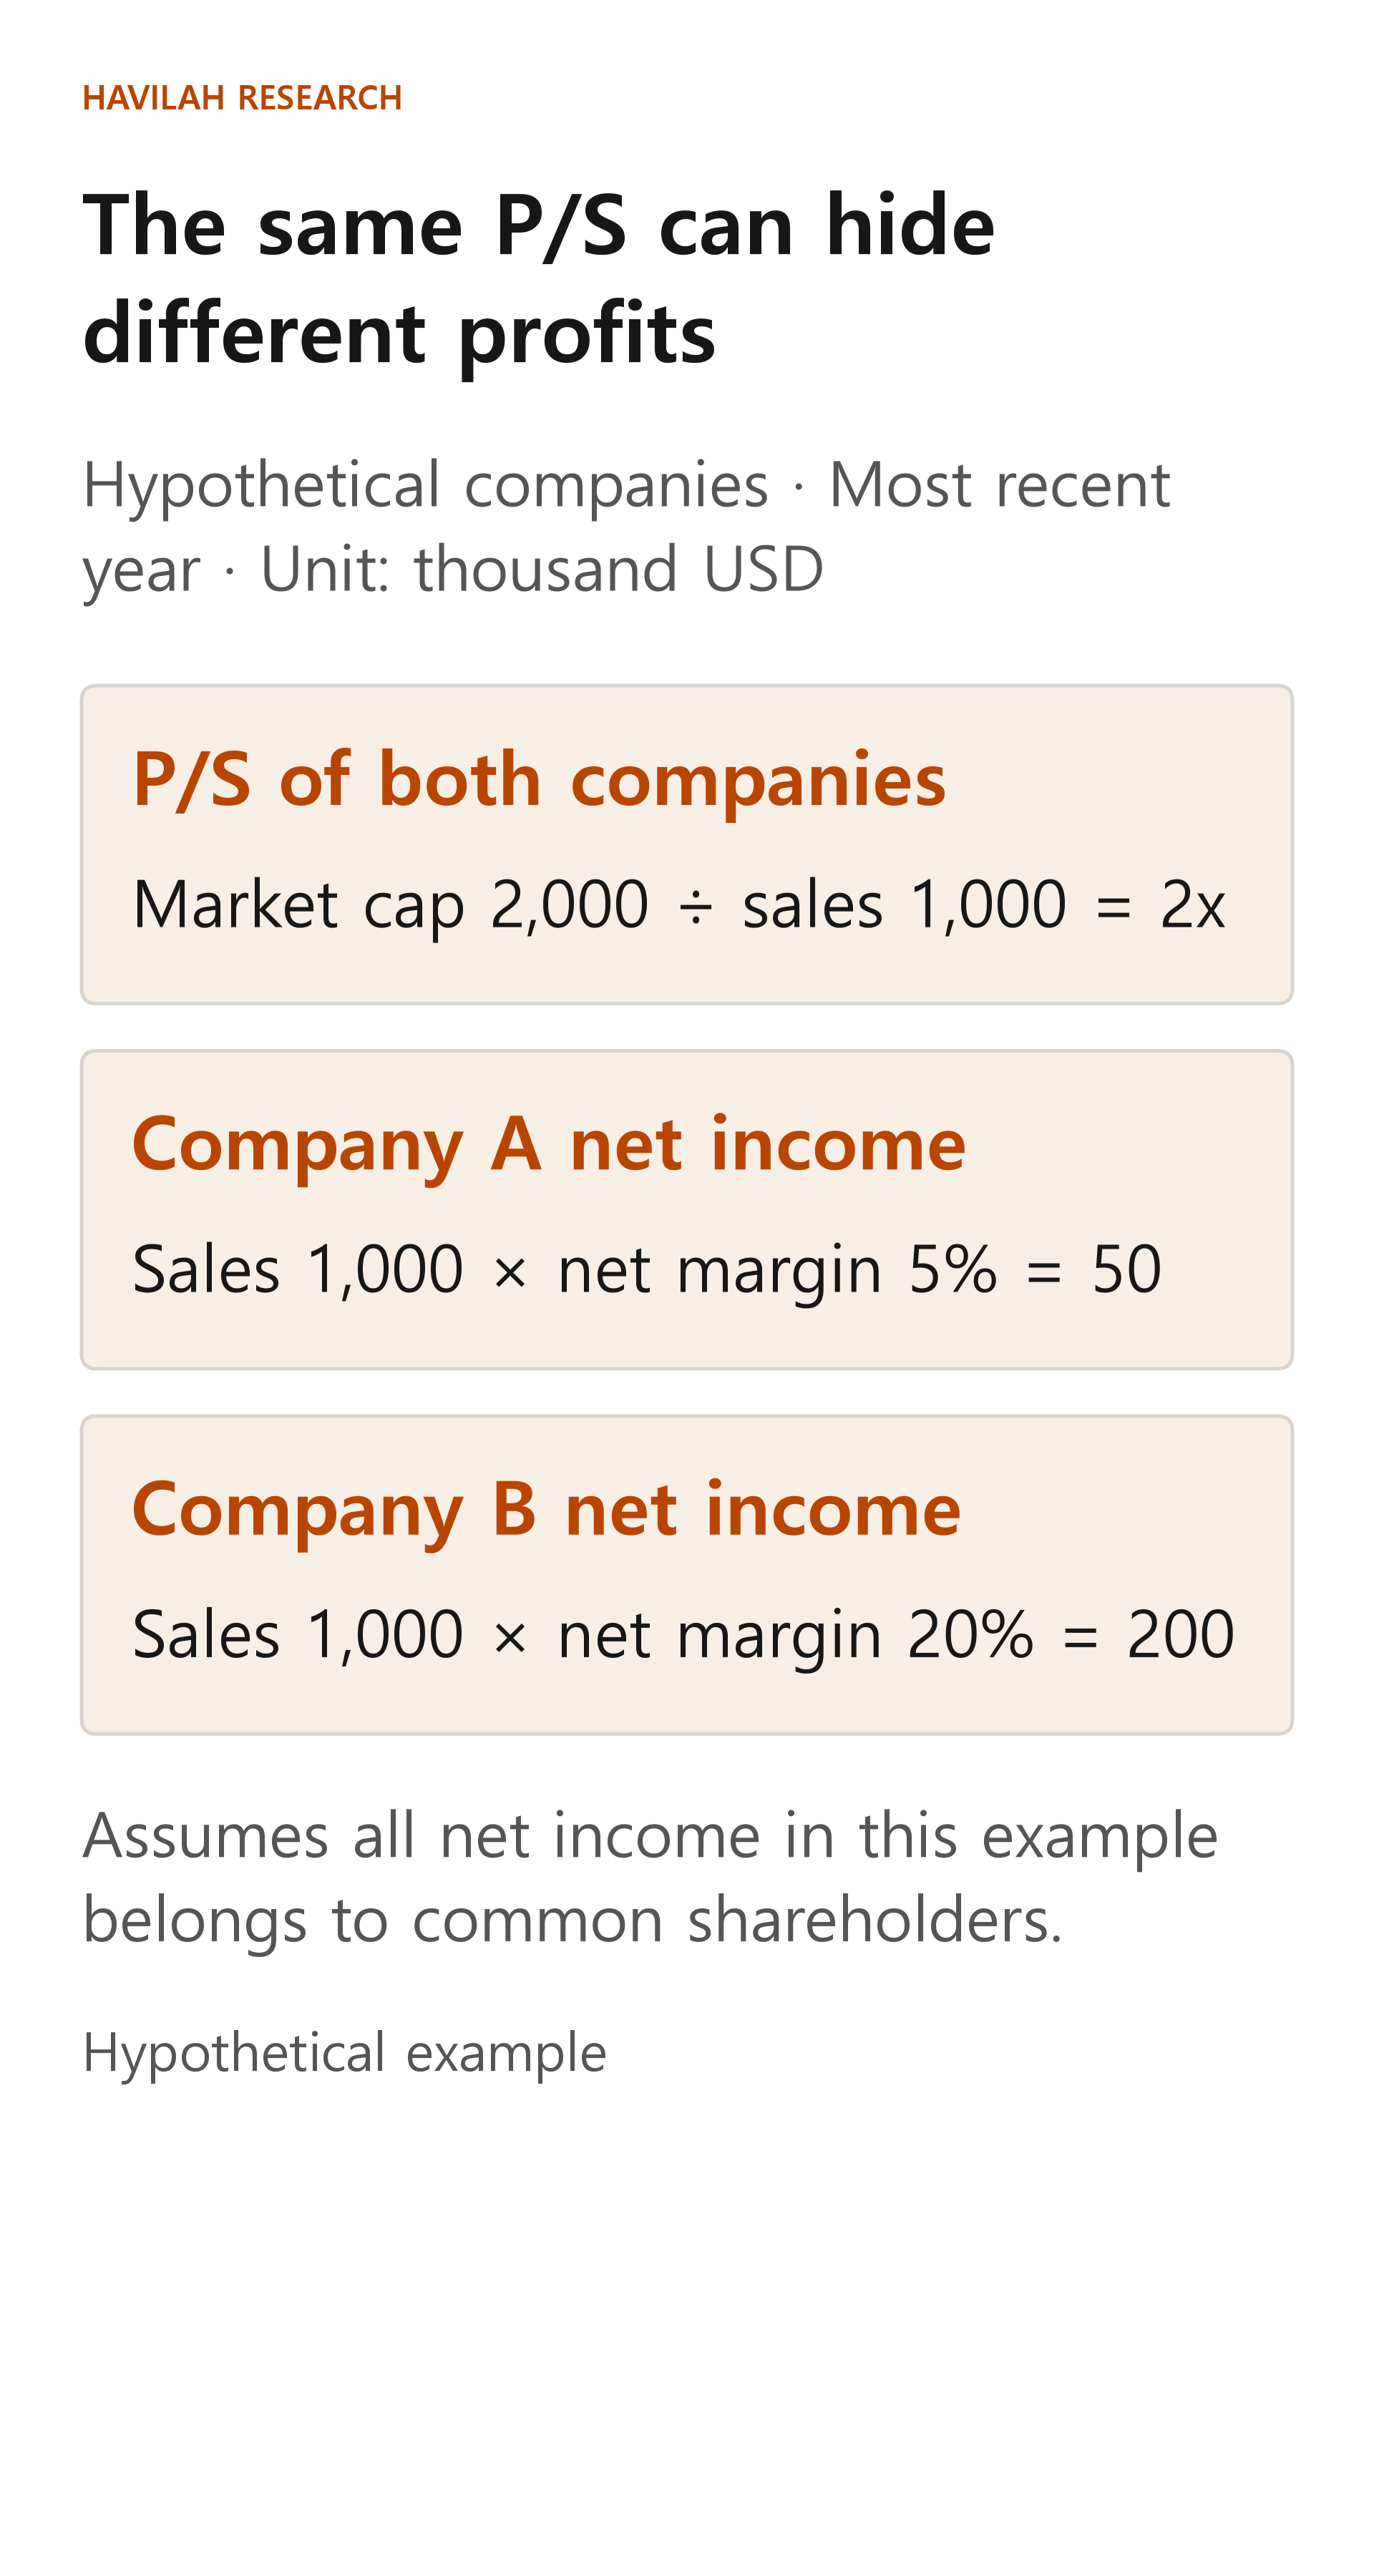
In other words, the same P/S can hide different amounts of profit. Still, this example alone does not let you conclude that Company B is necessarily a good investment, because future revenue, margins and risks can change.
Why do companies keep different portions of their revenue?
A company that makes its own products spends money on materials and running factories, while a software company may spend heavily on development and on winning customers. You cannot tell which company keeps more just from the name of its industry. You need to look at prices, sales volumes, production and labor costs, and how much investment the business requires.
Even if a company is losing money now, you can assess whether its profitability might improve as its customer base grows. When you do, do not stop at assuming that "once revenue grows, profits will follow." Check how the cost of winning customers and the cost of delivering the service would need to change. Also think about what happens if margins do not improve.
If debt levels differ, check EV as well
P/S uses only the market value of the shares as its numerator. If you divide enterprise value (EV), which you learned about in Lesson 110, by revenue, you can compare the price of the whole business, taking debt, cash and similar items into account, with revenue.
For example, take a hypothetical company with a market cap of $2 million, $500,000 of debt and $200,000 of cash. If the book value of the debt equals its market value, there are no other adjustment items and all of the cash is subtracted, its simple EV is $2.3 million. With annual revenue of $1 million, EV/revenue is $2.3 million ÷ $1 million = 2.3x. This differs from the same company's P/S of 2x because the numerator is different.
EV can vary depending on how preferred shares, non-controlling interests, leases, restricted cash and similar items are treated. Also check the reference date and calculation method of each data source.
When you look at real companies
First, check whether the revenue is the actual result for the most recent year or a forecast, and compare using the same period and the same currency. Next, see whether the companies recognize revenue in similar ways and have similar business mixes. Some companies record the full value of a transaction as revenue, while others record only the fee they receive, so comparing only the apparent size of revenue can mislead you.
Then look at margins, cash flow, debt and growth potential together. A low P/S can be a reason to look further, but it does not automatically mean the stock is undervalued. A high P/S, in the same way, leaves you with questions about future profitability that you need to check.