
The news says the economy has improved. Yet you also hear people around you say that prices are high and jobs are hard to find. Does one of these have to be wrong?
The economy is hard to describe with a single number. Output can be growing while life is still hard for some people. As an investor, start by telling apart what each number actually shows.
How much did the whole economy produce?
Gross domestic product, or GDP, adds up the value of the final goods and services produced within a country over a given period. Products and services that are finally consumed, such as bread sold in a shop or a haircut, count toward it. If you added the full value of the flour that goes into the bread and the full value of the finished bread, you would count the same production twice, so GDP is based on final output.
If GDP rises only because prices went up, you cannot really say more was produced. That is why people look at real GDP, which strips out the effect of price changes. Even so, a rise in real GDP does not mean that everyone's income or every company's revenue went up.
When you look at U.S. quarterly growth rates, also pay attention to how they are reported. The United States usually reports them as an annualized rate: the change in one quarter is converted as if the same pace continued for four quarters. For example, if the economy grows 1% in one quarter and you assume that pace repeats four times, the annualized rate is not simply 4%. It is about 4.06%: 1.01 to the fourth power, minus 1. This is not a forecast that the economy will actually grow that way over the next four quarters.
What is happening with jobs?
People who are working and people classified as unemployed together make up the labor force. In the United States, people count as unemployed if they are not working, are available for work and have actively looked for a job. People on temporary layoff who meet certain conditions can be classified as unemployed even if they are not actively looking. The official U.S. unemployment rate is the share of this labor force that is classified as unemployed.
Suppose that in a hypothetical survey, 95 people are working and 5 people are available for work and actively looking for a job. The labor force is 95 + 5 = 100 people, and the unemployment rate is 5 ÷ 100 × 100 = 5%.
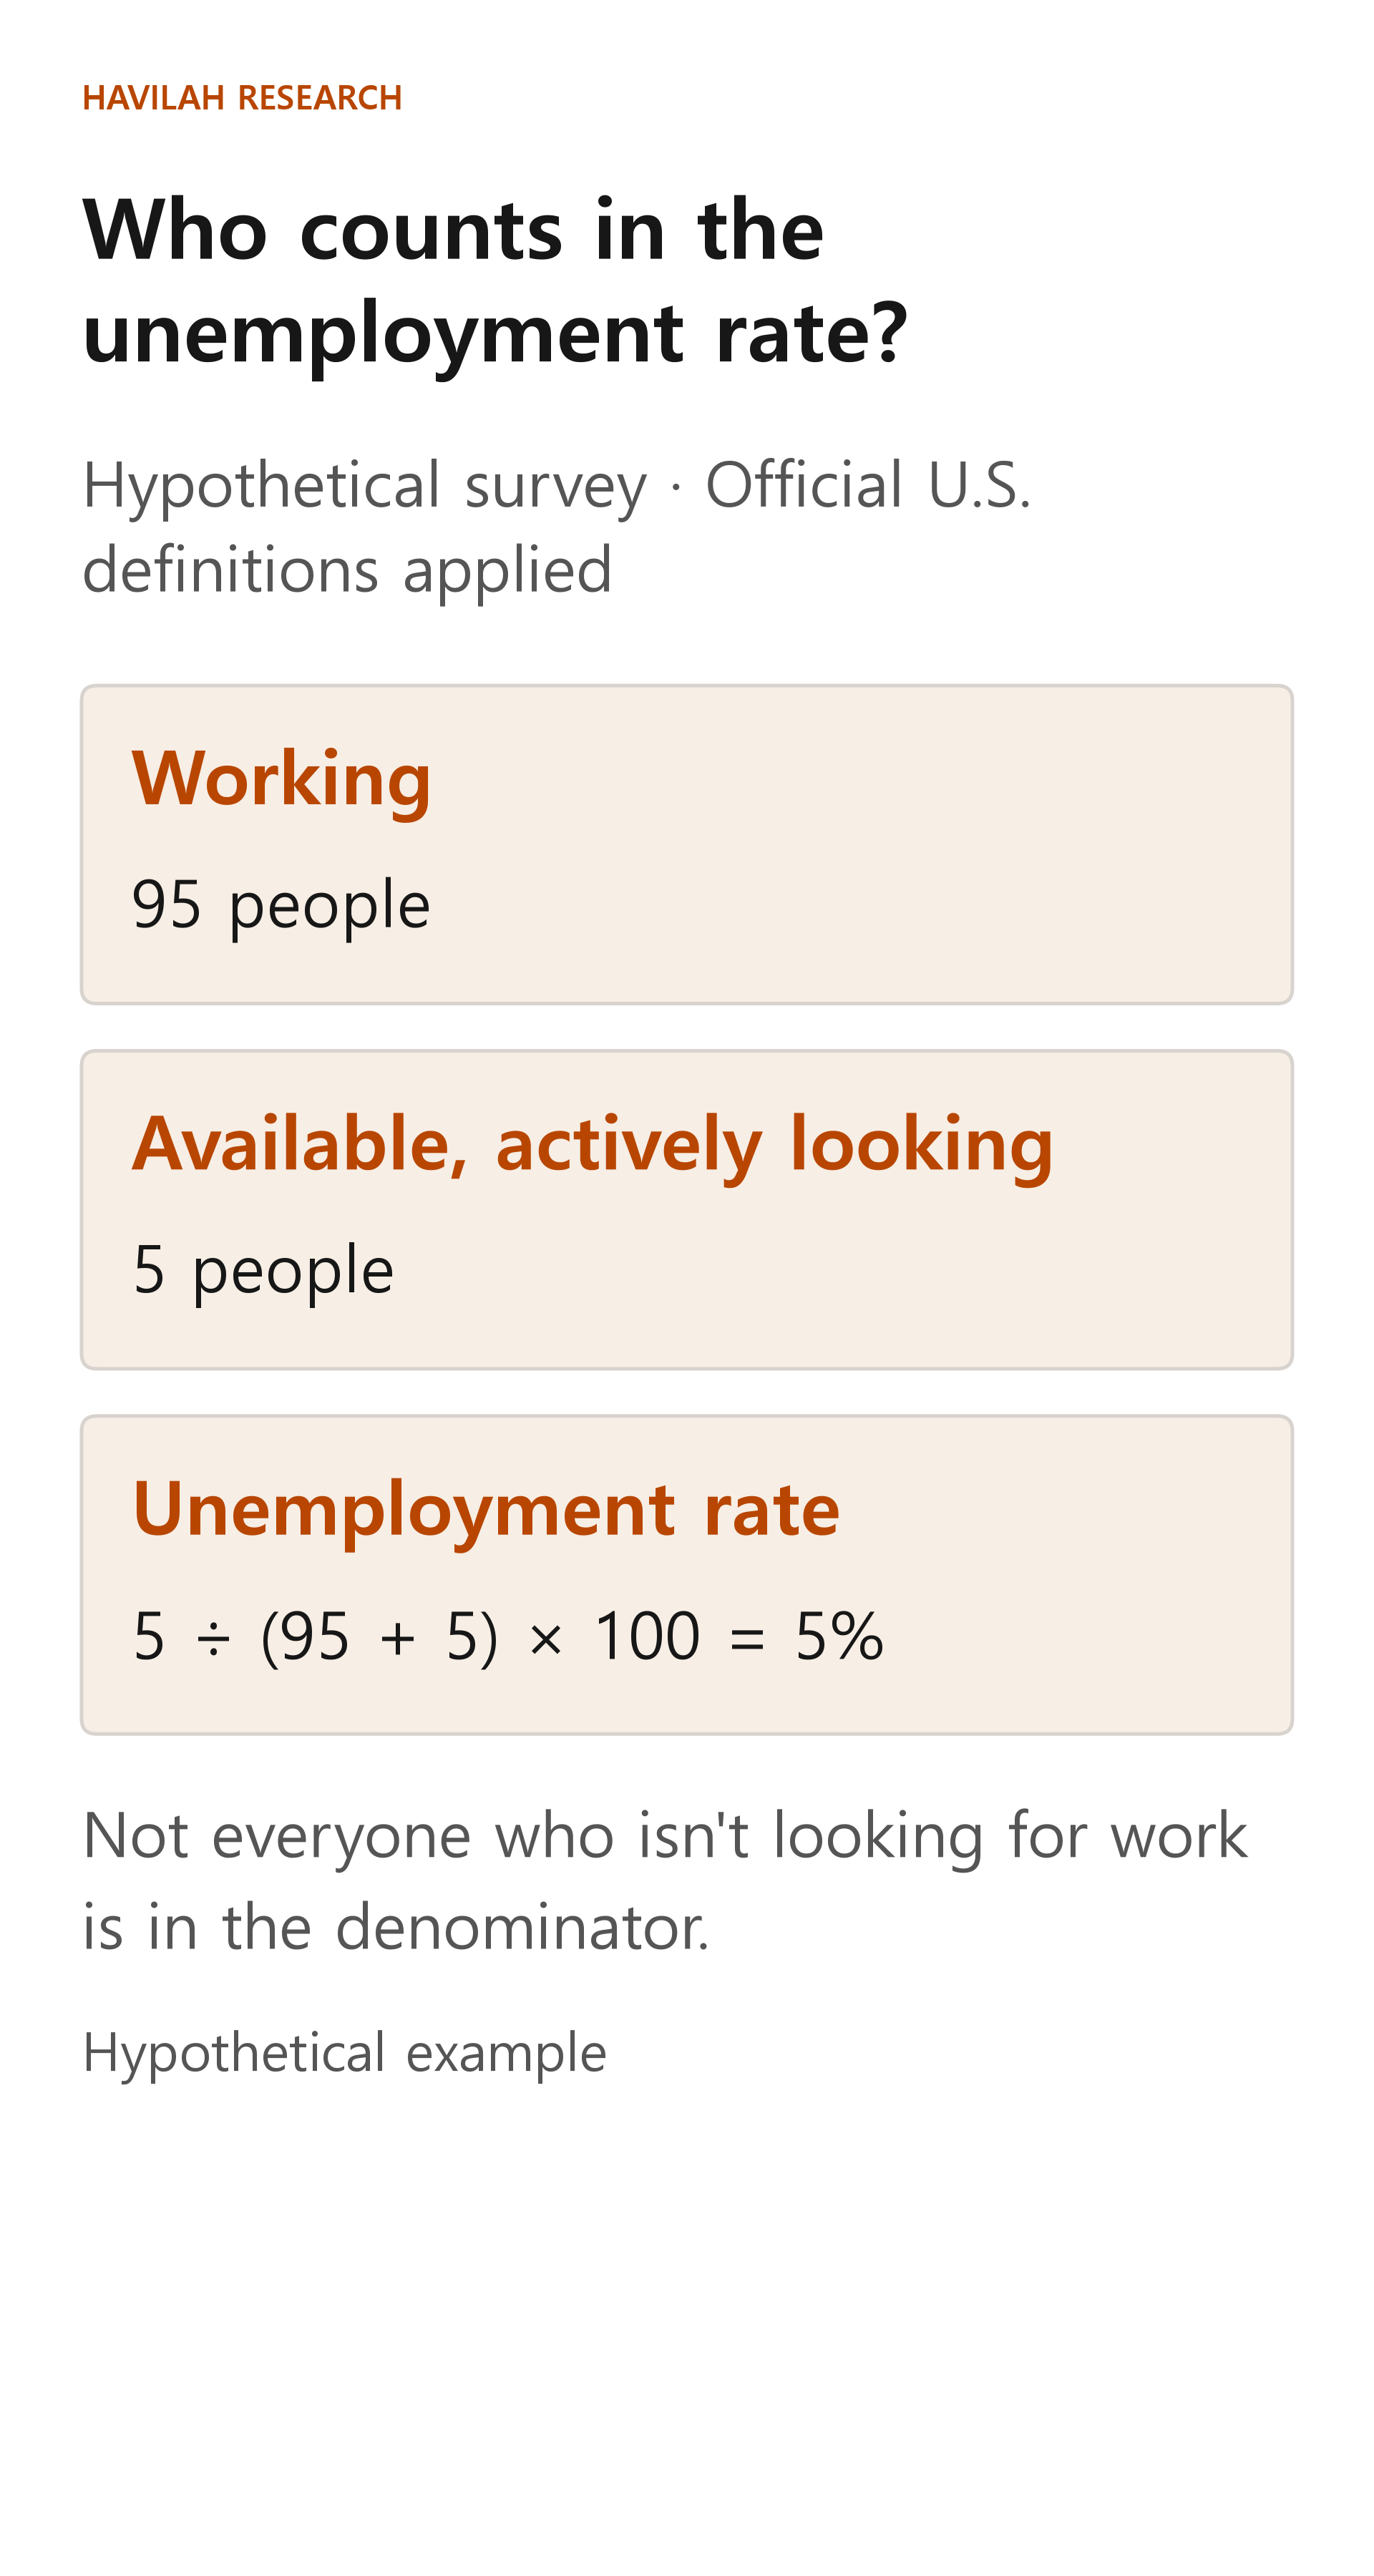
Not everyone who is out of work is counted in the unemployment rate. Under the official U.S. definition, people who are not looking for a job may not be counted in the labor force at all. So rather than looking at the unemployment rate alone, it helps to also look at changes in the number of people working and at the share of people who take part in the labor force.
Are people spending and companies producing?
Consumer spending indicators help you see how much people are spending on goods and services. U.S. personal consumption expenditures show the value of goods and services purchased by or on behalf of U.S. residents. Spending can rise simply because prices went up, so also look at real spending, which adjusts for price changes.
Production indicators show how output is changing in areas such as manufacturing plants, mining, and electric and gas utilities. However, industrial production does not represent all the services in the U.S. economy. A retailer and a semiconductor equipment maker may also be affected differently by changes in spending and production.
Prices can keep rising while the inflation rate falls
The inflation rate shows how much the price level has changed compared with an earlier period. The U.S. consumer price index (CPI) tracks the average change in the prices that urban consumers pay for goods and services.
Suppose a hypothetical price index starts at 100 and, after 1 year, has risen 4% to 104. If it rises another 2% the next year, it becomes 104 × 1.02 = 106.08. The rate of increase fell from 4% to 2%, but the price level still went up, from 104 to 106.08. Do not confuse this with a case where the price level actually falls.
Do good economic numbers mean good stock returns?
Economic indicators help you understand the environment a company operates in. Rising consumer spending can be a sales opportunity for some companies, but if wages or raw material prices rise at the same time, costs can also go up. Each company has different customers, regions and cost structures, so look at the effect on each one separately.
Share prices can be affected not only by the numbers that are released, but also by what people expected before the release and by how they see interest rates and companies' future profits. You cannot conclude that share prices will rise just because economic growth is high.
When you look at an indicator, check which country the data comes from, when it was released and which period it measures. A change from the previous period is also different from a change from the same period a year earlier. First-release figures can be revised as more data comes in, so keep the figure published at the time of release separate from the later revised figure.