
A company says, "Our products have an edge over our competitors'." How can you, as an investor, check that claim?
Along with looking at how customers respond and what competitors offer, you can see how much a company keeps from what it sells after subtracting its costs. But a high profit margin on its own cannot tell you for certain why the margin is high.
First subtract the cost of the products
Suppose hypothetical Company A and Company B each had revenue of $1,000 in a year. Company A spent $600 making and delivering its products, and Company B spent $700.
Company A: revenue $1,000 − product costs $600 = gross profit $400.
Company B: revenue $1,000 − product costs $700 = gross profit $300.
Gross profit is revenue minus the cost of providing the products or services that were sold. It is not net income, because the other costs of selling and running the company still have to come out of it.
Gross profit divided by revenue is called the gross margin. For Company A it is $400 ÷ $1,000 × 100 = 40%, and for Company B it is $300 ÷ $1,000 × 100 = 30%. This means that out of every $100 of revenue, $40 and $30 respectively are left after product costs.
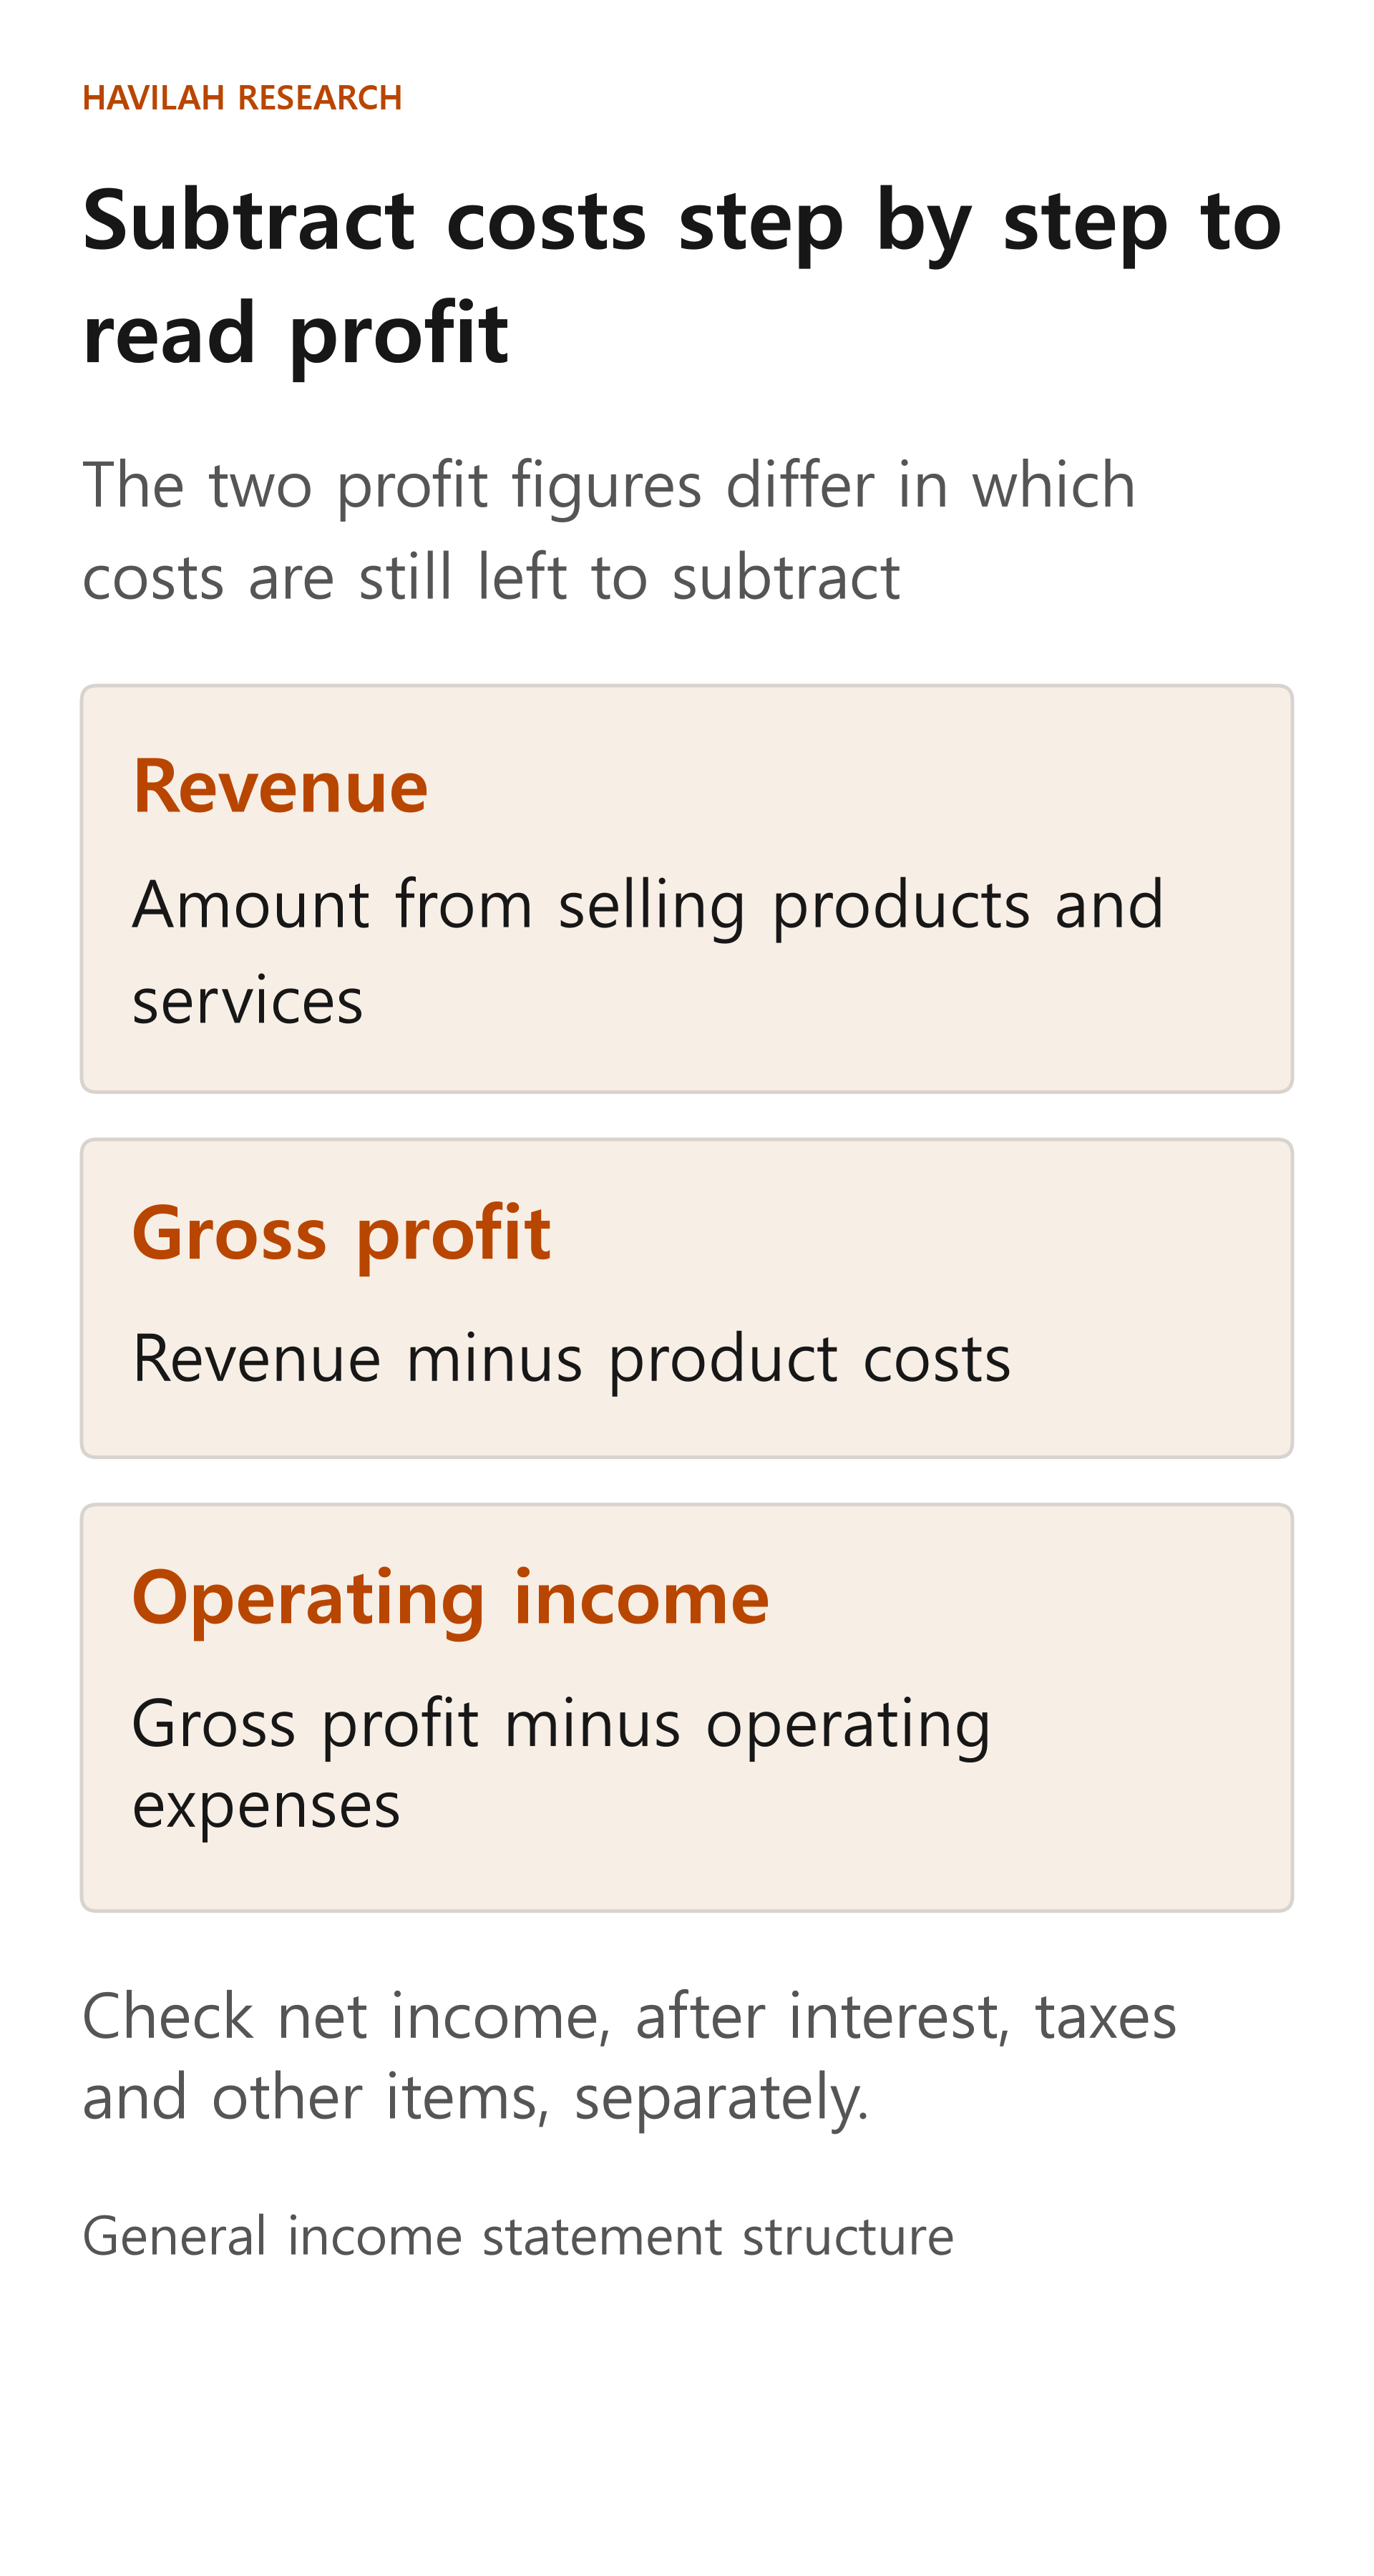
Subtract operating expenses too, and the ranking can flip
Now assume that Company A spent another $300 on selling and running the business, and Company B spent another $150.
Company A: gross profit $400 − operating expenses $300 = operating income $100.
Company B: gross profit $300 − operating expenses $150 = operating income $150.
Operating income divided by revenue is the operating margin: 10% for Company A and 15% for Company B. Hypothetical Company A had the higher margin after product costs, but once operating expenses are included, Company B's margin is higher. This is also different from the net margin, which takes interest, taxes and other items into account.
Companies spend money on advertising and customer support to sell their products, and they invest in developing new ones. High spending is not always waste, and low spending is not always good. You need to look at what role those costs play in winning customers and building the future business.
Find out why the numbers are high
Margins can improve because selling prices are higher or product costs are lower. But they also change when more expensive products make up a larger share of sales, or when costs fall temporarily. Before you conclude that a company has become more competitive, look at its explanations together with the numbers over several periods.
For example, Costco explains in its annual report that choosing to lower prices for customers, or to hold prices even when costs rise, can affect its gross margin. In other words, the reasons a margin falls can include both the competitive situation and the company's own pricing policy. This example alone does not tell you whether the strategy will succeed in the future.
What is easy to miss when comparing
Compare companies with similar products and customers over the same period. A manufacturer and a software company have different product cost structures, so a difference in their margins alone is not enough to conclude which one is more competitive. You also need to check how each company classifies its cost items.
Also look at whether margins have held up over several years, whether customers accept the prices, and whether a company has boosted short-term profits simply by cutting research and development. A margin is a clue for investigating competitive strength. The next step is to check why the number came out as it did and whether it can last.