
"If you had invested this way for the past 10 years, you would have made a lot of money." When you see a result like this, you may want to copy it right away. But there is a question to ask first: did the calculation include the companies that failed along the way?
Applying trading rules to past data and looking at the results is called a backtest. It helps you test your ideas, but the calculated result is not a return that anyone actually earned by trading at the time. The result also changes depending on which data was put in and which was left out.
The illusion of looking only at the companies that survived
Suppose you invested $1,000 in each of three hypothetical companies, A, B and C. Over the same period, A rose 50% and B rose 10%, while C lost the entire investment and its value fell to $0. Dividends, costs and taxes are left out. These are illustrative numbers, not the results of real companies.
| Company | Starting amount | Assumed change | Ending amount |
|---|---|---|---|
| A | $1,000 | +50% | $1,500 |
| B | $1,000 | +10% | $1,100 |
| C | $1,000 | -100% | $0 |
If you include all three companies, the initial $3,000 ends up as $2,600. That is a $400 loss, so the return is -400 ÷ 3,000 × 100 = about -13.33%.
But what if you look only at A and B, which are still around at the end, and calculate as if you had invested in those two companies from the start? The initial $2,000 becomes $2,600, and the return looks like 600 ÷ 2,000 × 100 = 30%. Both are hypothetical results for the same period, yet the conclusion changed because the companies included and the starting amount were different.
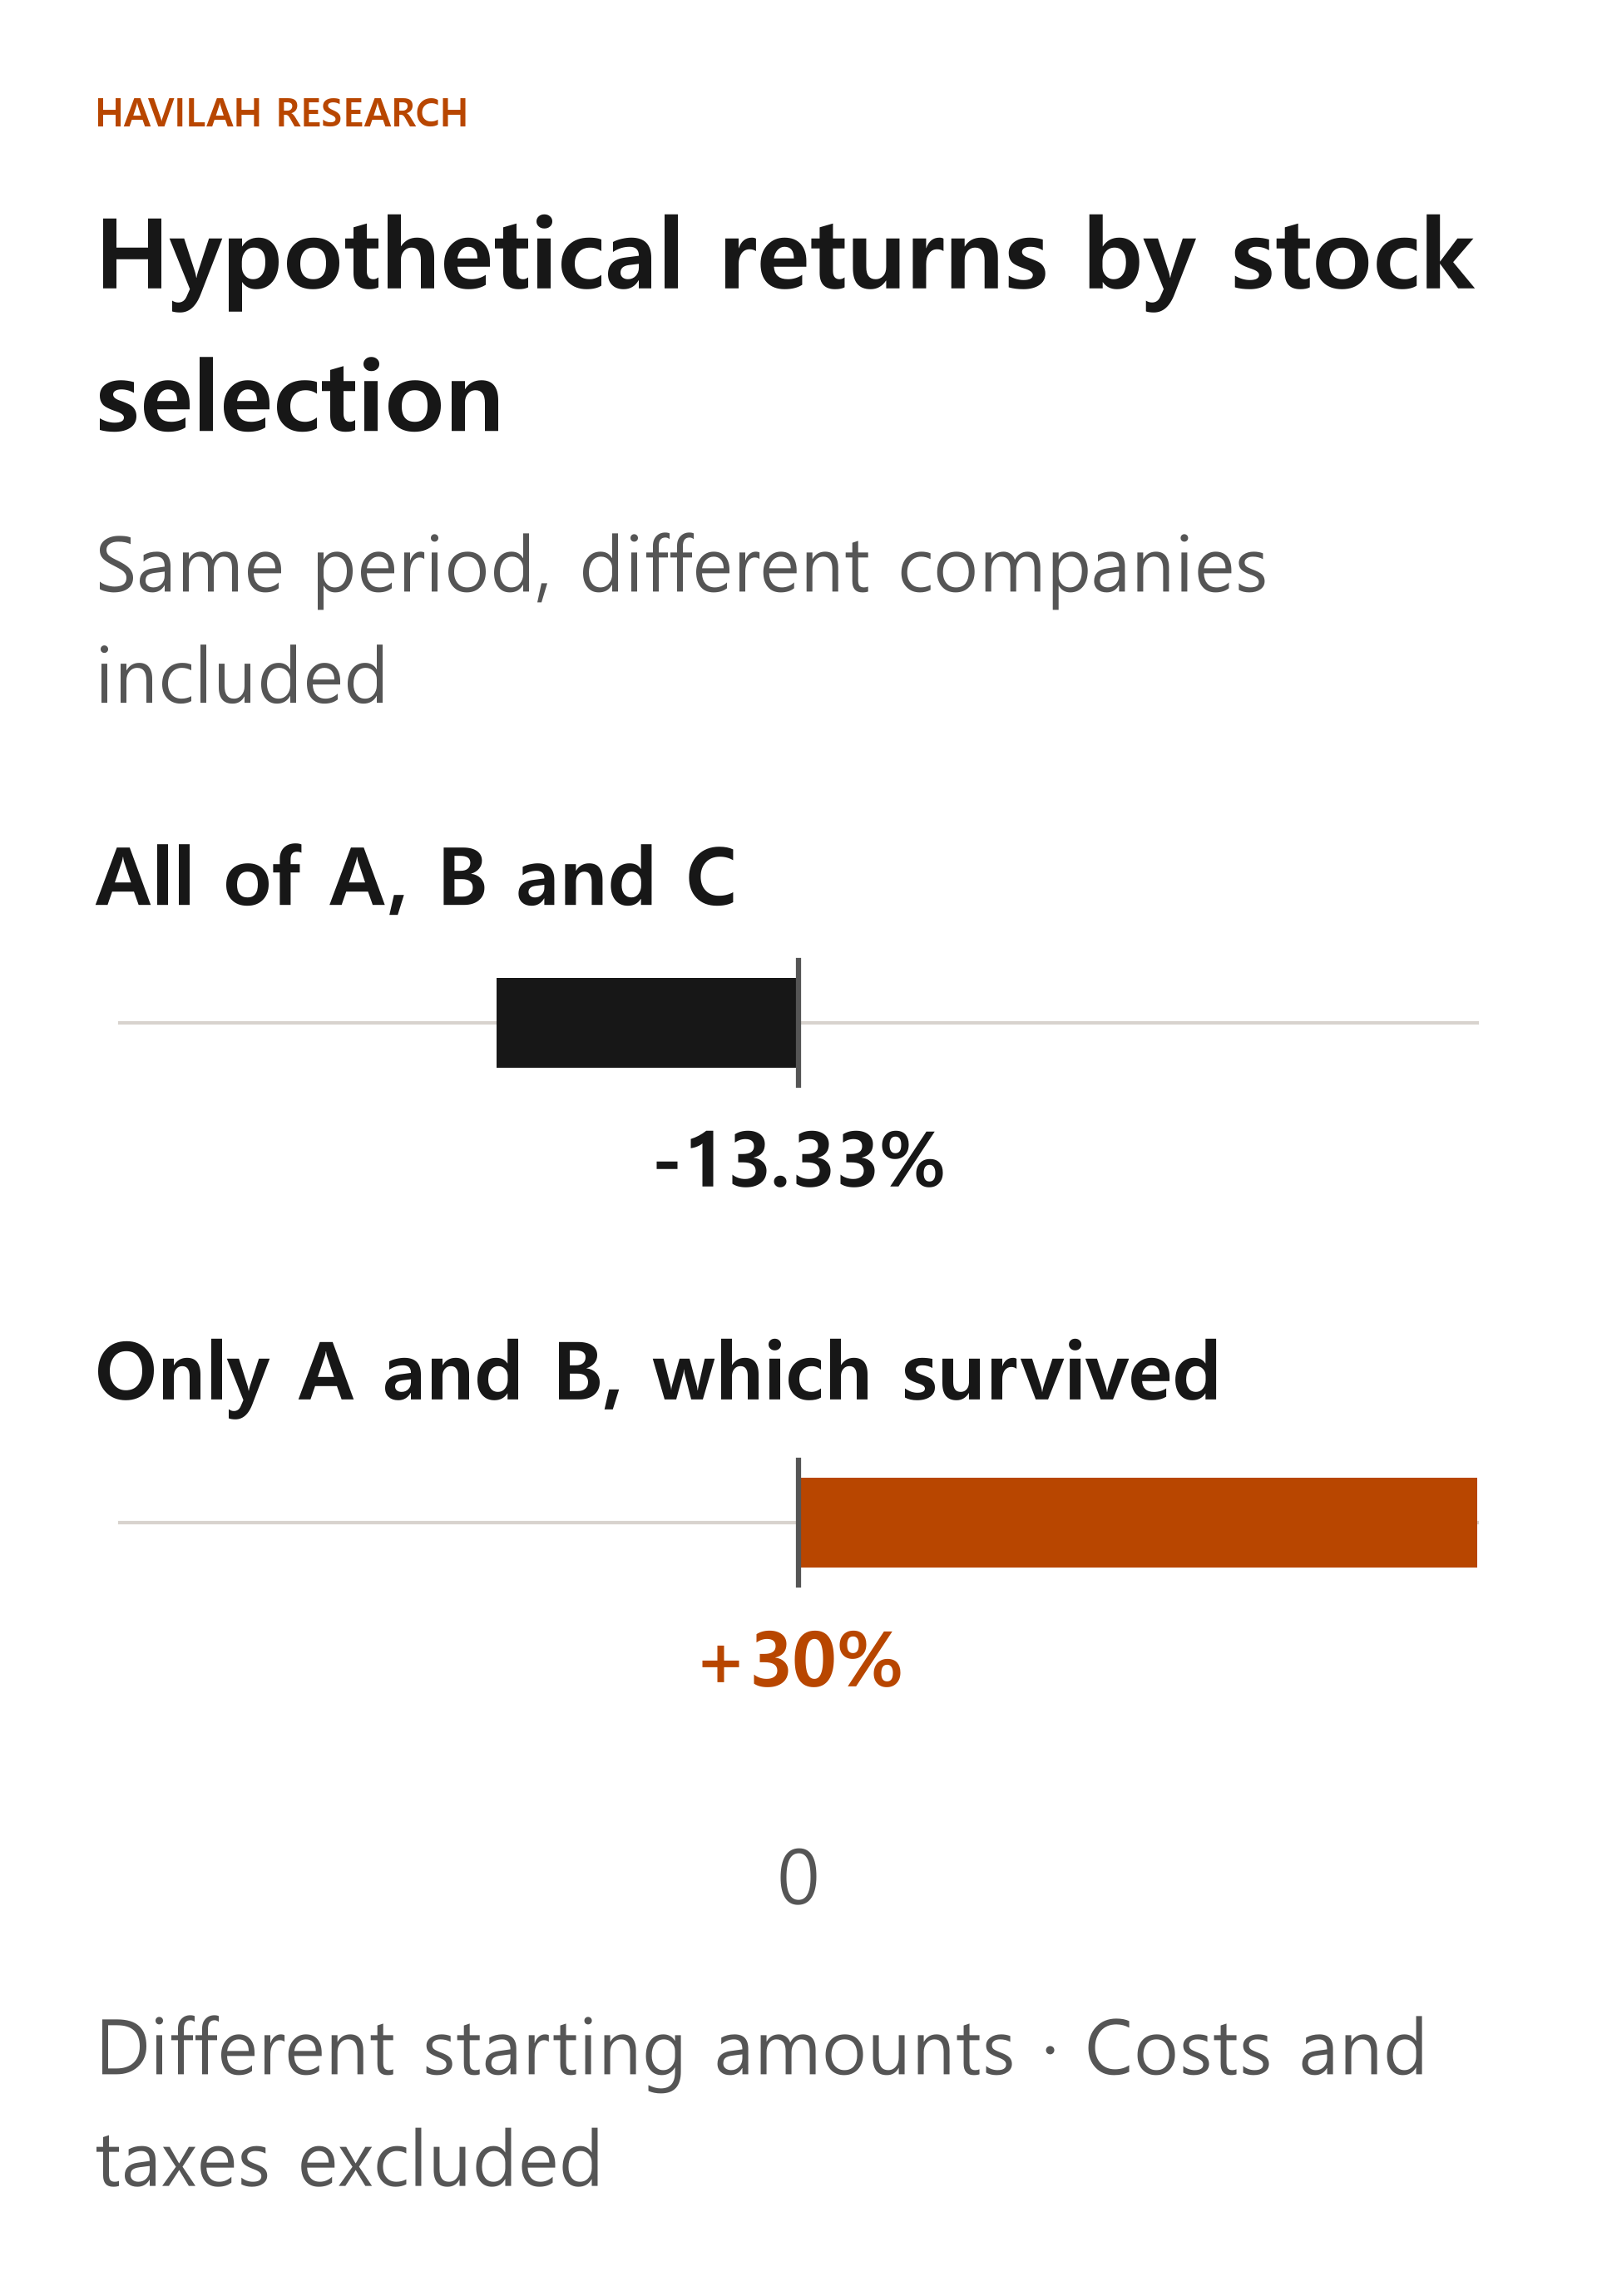
This problem of leaving out what failed and dropped off the list, and looking only at what survived, is called survivorship bias. The case above is a simple calculation to show the effect of selection; it is not the result of a real backtest. Nor does it mean that a delisted stock always loses 100%. The reasons for a merger, an acquisition or a delisting, and the amount investors actually got back, can differ from case to case.
Picking only the winners makes results look better
You might also test a strategy on companies that you already know rose sharply in the past. For example, you pick a few companies that are famous today and calculate "what if I had bought these 10 years ago." That question is not wrong in itself, but it is a different question from what criteria you could have used back then to pick those companies in advance.
To examine a strategy's performance, set stock-selection criteria that could have been applied at the time, and check every company that met those criteria. You may also need records of companies that were delisted, renamed or merged. If you left some out because data was missing, state which companies were dropped and why.
That said, if a study covered only large-cap stocks from the start, you can interpret its results within that scope. The problem is claiming that the results apply equally to all stocks without saying it was a study of large caps, or picking only the large caps that survived and treating them as if they had been all the large caps of the past.
The list of stocks is not everything
Fixing the list of companies does not immediately give you a strategy you can trust. You need to check whether the historical data was accurate and how dividends were handled. Also check how stock splits were reflected, and whether the test assumed you could trade at prices and in quantities where trading would in fact have been difficult.
Commissions, the difference between buying and selling prices, and taxes also affect the results. If someone tested many strategies and shows you only the best result, you also need to look at the failed results you cannot see. When you compare strategies, the starting point is to use the same period and the same conditions.
Questions to ask when you look at results
First, find out whether the result is a record of actual trades or a hypothetical calculation. Next, check the test period, the range of stocks chosen at the start, how delisted companies were handled, and the costs and the benchmark used for comparison. Without this information, it is hard to judge how good a strategy really is from a high return alone.
Even if past results were good, there is no guarantee that the same performance will repeat. In the next lesson, we will look at the illusions that arise when information that could not actually have been known at the time gets into a test.