
Once you have analyzed a company and studied its chart, it is time to decide. You need to settle not only when to buy, but also what you will do if the price moves differently from what you expect.
Let's practice building a plan while looking at real past prices. The prices below are historical data; the trading levels and share quantities are assumptions made up for illustration. They do not mean any trade was actually made, and they are not a current investment recommendation.
Start by choosing the company and the point in time
Let's use Apple as an example. On October 31, 2024, Apple reported revenue of $94.9 billion for the fourth quarter (Q4) of fiscal 2024. That figure is the result for the quarter that ended on September 28, 2024. Rather than deciding whether to invest based on a single line saying results were good, you should look further into revenue and costs by product and the risks ahead.
The chart below connects Apple's closing prices on six U.S. trading days from October 24 to October 31, 2024. It leaves out the movements within each day and shows only each day's last price.
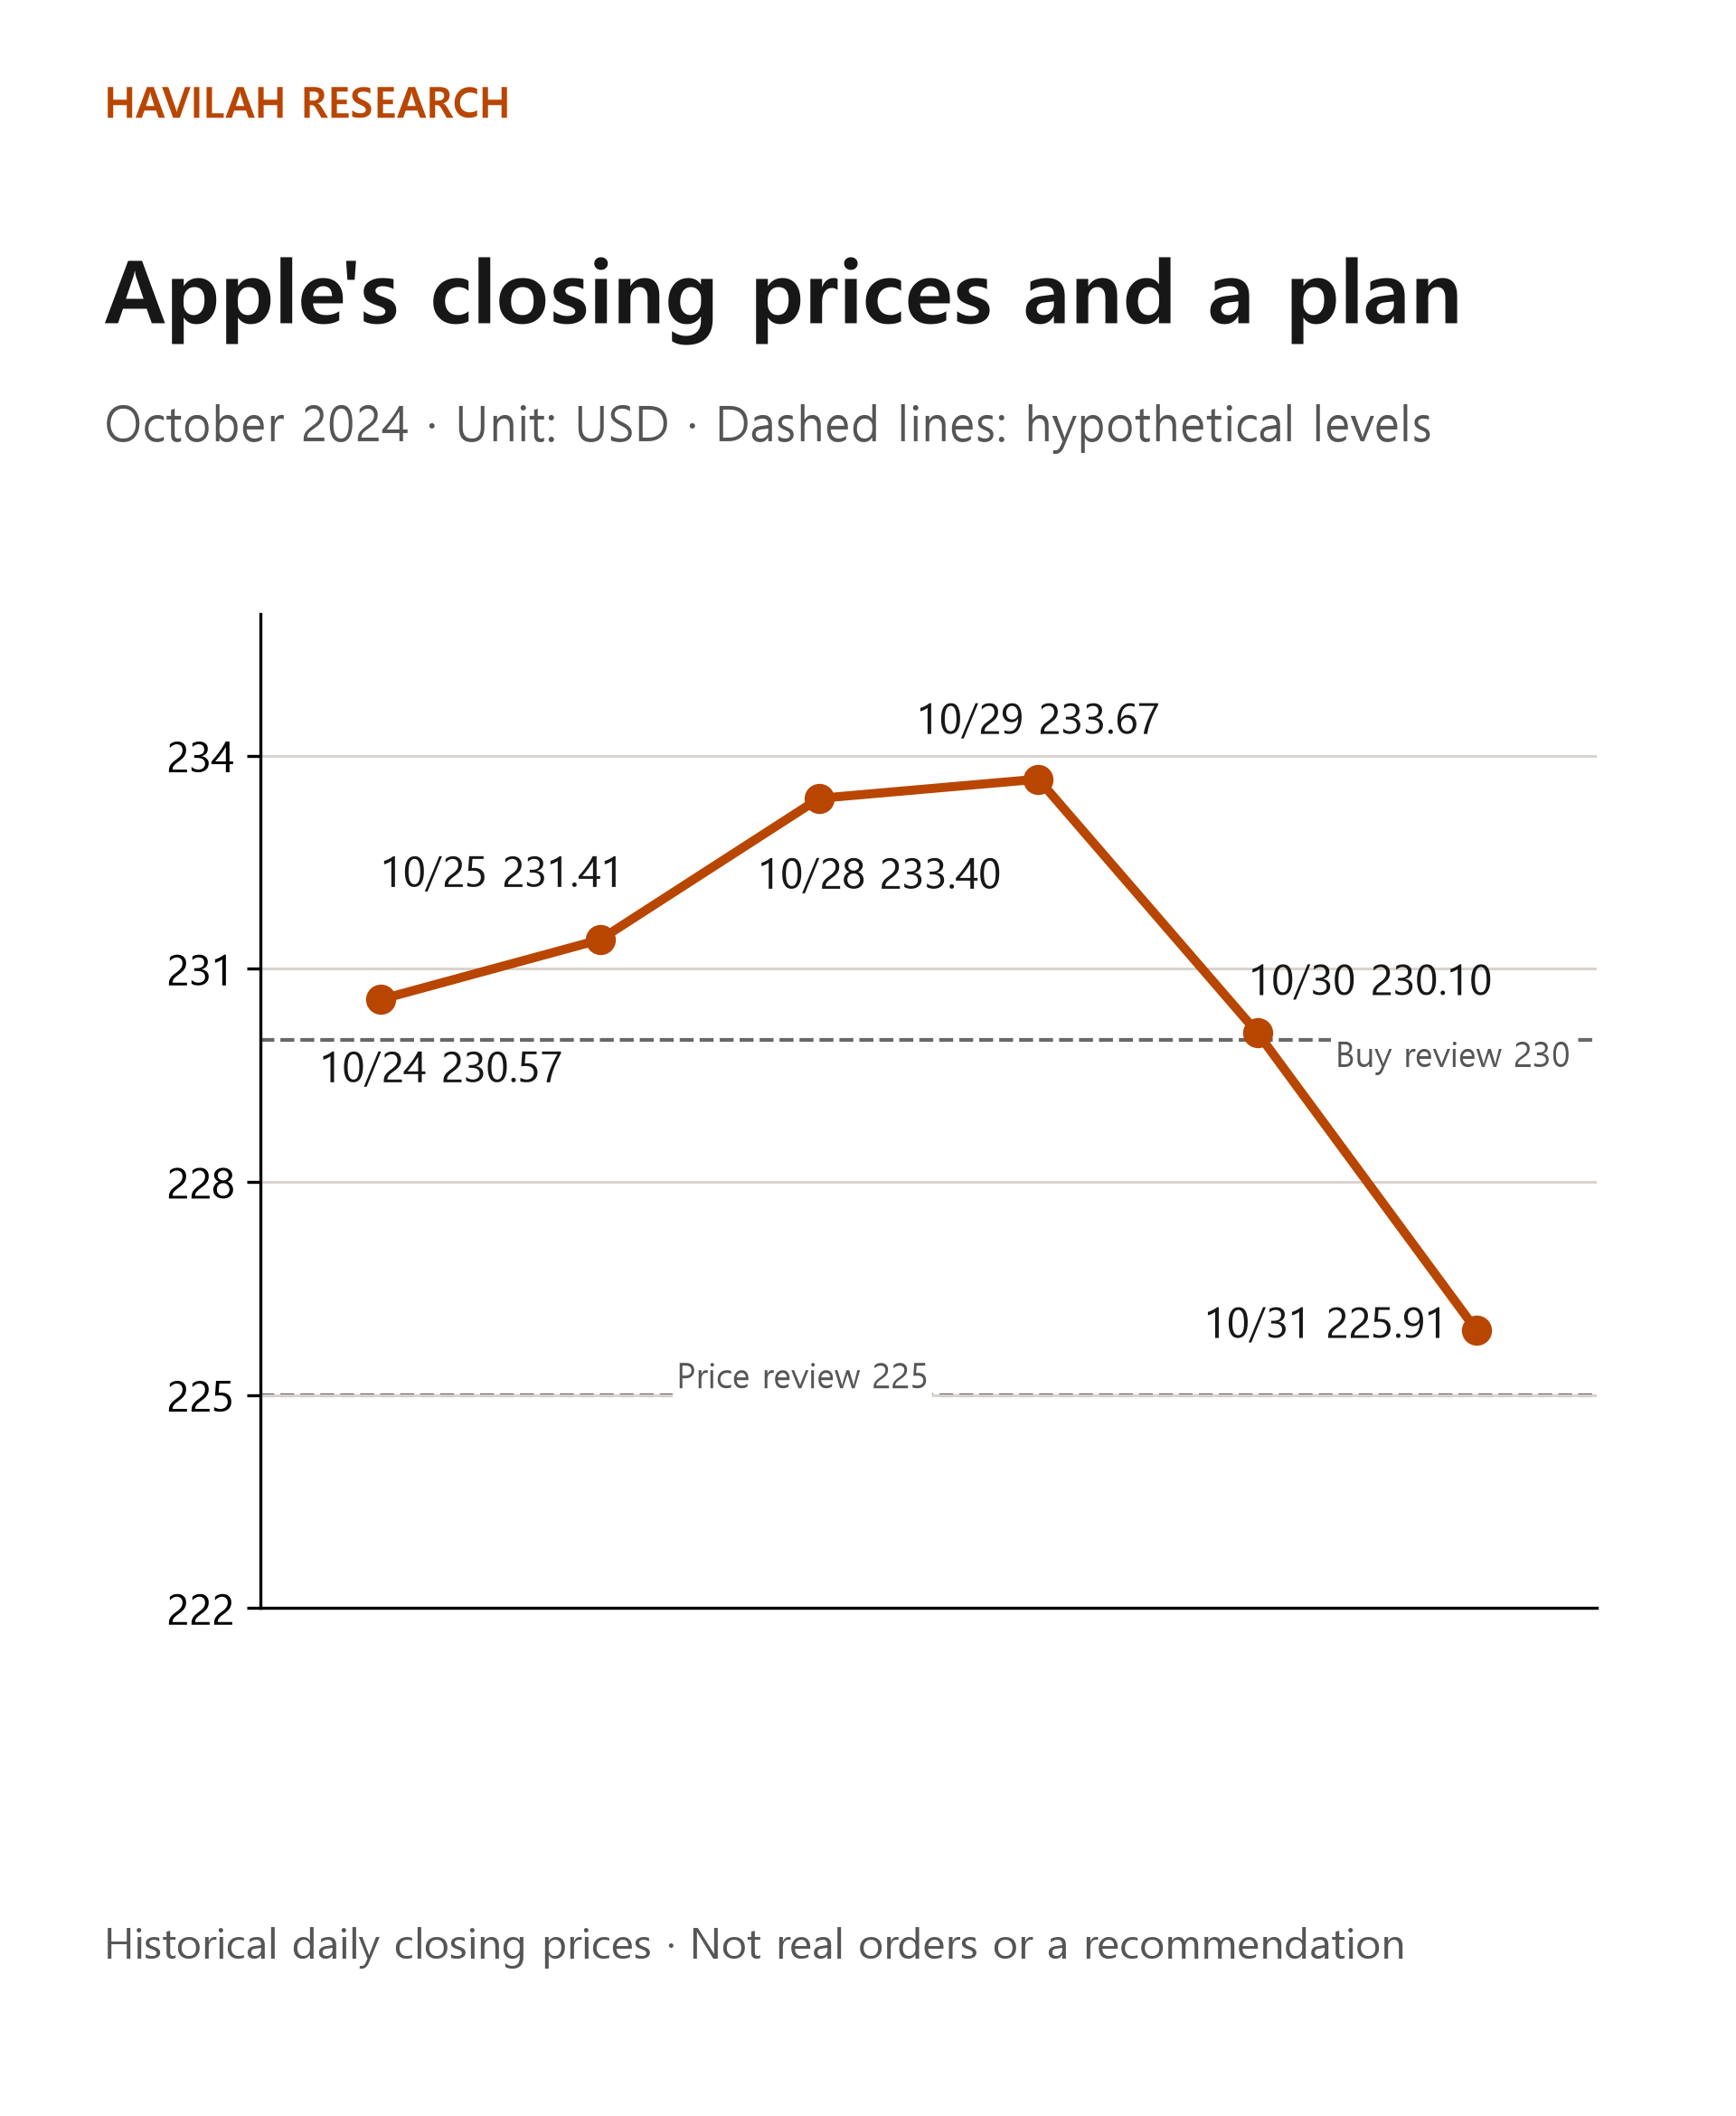
The two dashed lines are not real orders or forecasts. They are hypothetical levels that show how to mark a plan on a chart. Assume the plan is made after reading the company's October 31 announcement. No prices from after the last close in the chart are used.
Setting conditions for buying and buying more
For instance, after reviewing Apple's business and results further, an investor might write down: "If the stock closes at $230 or higher, I will take another look at buying." The $230 level is just a reference point chosen arbitrarily for this example; it is not the right price or a recommended price.
Even when a buy signal appears, the price at which your order is actually filled may be different. For this calculation, assume you can later buy one share at $230. For 10 shares, you would need 230 × 10 = $2,300. Commissions and currency conversion costs are left out.
If you are thinking about buying more later, it is better to set specific conditions than to say "I will buy whenever the price falls." For example, you might consider buying more only if revenue from the business you wanted to check in the earnings releases keeps improving, and this stock's weight in your total investment money stays within a limit you set in advance. Even when the conditions are met, that does not mean you have to buy more.
Deciding when to reduce or get out
The investor might write down $225 as the level at which to review the position based on price. If you bought 10 shares at $230 and then sold them all at exactly $225, the difference would be $5 per share, and the total loss would be 5 × 10 = $50. Again, commissions and exchange-rate changes are left out.
The $225 level does not limit your loss to $50. If the price jumps past that level, or your order is not filled at the price you want, the actual loss can be larger. Keep the fact that the price touched a level separate from an actual filled sell order.
On the other hand, if the price rises more than you expected and the position's weight grows, you might consider trimming part of it. And if the company's main business or earnings outlook changes from what you first thought, you should revisit your reasons for holding it, whatever the price.
Writing down why the plan could be wrong
The price could rise above $230 and then fall back, or drop below $225 and then rebound. Even if your analysis of the company is right, the share price may not move within the time you expect. A line on a chart is not a wall that guarantees an outcome.
Before you buy, briefly write down the business change you expect, the price at which you will consider buying and how many shares, your conditions for buying more, the situations in which you would reduce the position, and the facts that would change your mind. After you actually trade, record the plan and the filled results separately.
Even after you analyze a company, you cannot know the future result for certain. In the next lesson, we will look at the basic principles of ETFs, which hold many companies in a single product.