
When a shop you often visit is full of customers, business seems to be going well. But if it is giving big discounts to sell things cheaply, profit can fall even as revenue rises. And even if total revenue grew because the company opened more stores, its existing stores may have had fewer customers.
When you look at a retailer, you need to go one step beyond how much it sold. Let's look at whether the same stores grew, whether there were more customers, and how much was left over from the goods it sold.
Would revenue have grown without new stores?
When a company opens new stores, total revenue can rise even if the existing business stays the same. So companies group together stores that have been open for a certain period and compare their revenue with the same period last year. This is called same-store sales.
Hypothetical Shop A sold $100,000 at its existing stores last year. If the same stores sold $105,000 this year, same-store sales rose 5%. To calculate this, divide the $5,000 increase by last year's revenue of $100,000 and multiply by 100.
If the stores it opened this year sold another $10,000, total revenue is $115,000. Total revenue grew 15%, but revenue at existing stores grew 5%. The two numbers answer different questions. These numbers are hypothetical, not the results of a real company.
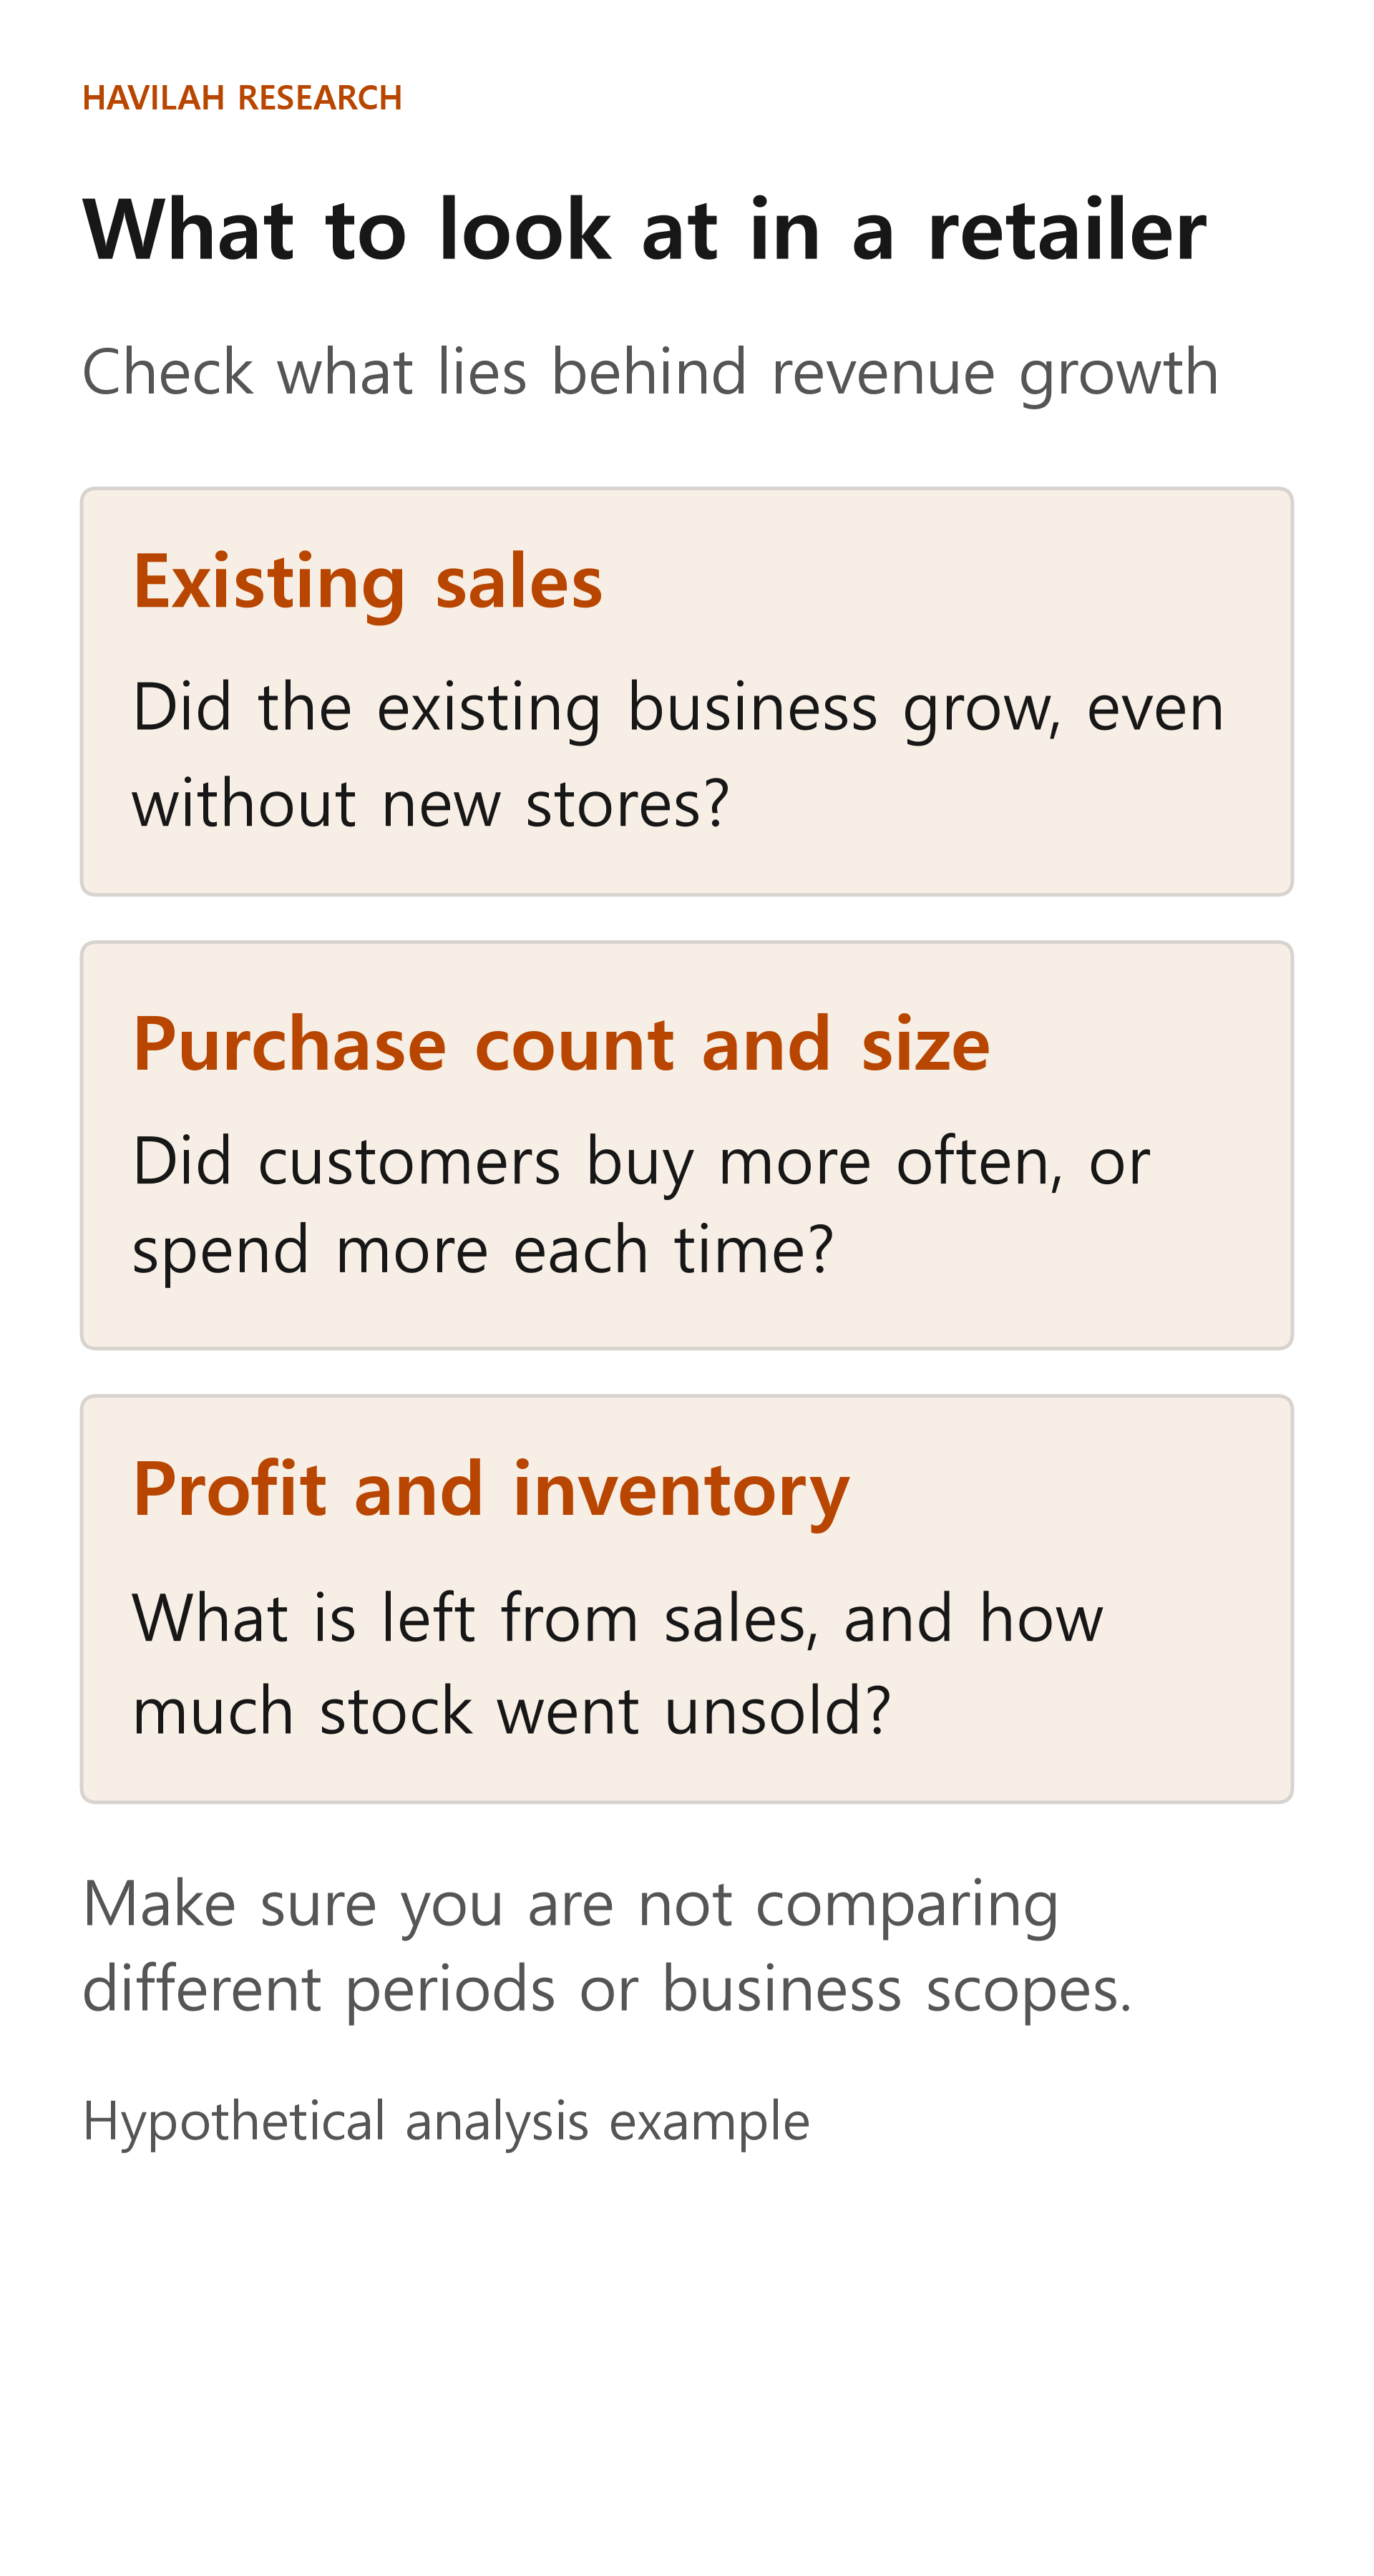
However, the definition of same-store sales differs from company to company. In its fiscal 2026 report, Walmart explained that its comparable sales include sales from stores that have been operating for a certain period, online sales and other items. Even when a number has the same name, first check whether its scope and comparison period are different.
Did more customers come, or did each one spend more?
Let's also break down why sales at existing stores grew. The number of transactions is how many times customers paid, and the average transaction value shows how much they spent on average each time they paid. Divide revenue by the number of transactions to get the average transaction value.
At the shop above, if there were 1,000 transactions last year and revenue was $100,000, the average transaction value was $100. If there are 1,050 transactions this year and the average transaction value stays at $100, revenue is $105,000. In this example, the rise in revenue comes from the larger number of transactions.
On the other hand, revenue can rise because prices went up even though the number of transactions fell. In that case, you cannot conclude that more goods were sold. Customers may be coming less often while price increases hide this for a while. The number of transactions is also not the same as the number of visitors, because one person can pay several times.
In periods when prices in general are rising, check not only sales in money terms but also sales volume. If the company does not disclose its sales volume, you should note that this part cannot be checked.
What matters is how much is left from revenue
Gross profit is what the company received for the goods it sold minus what it cost to obtain those goods. Gross margin is gross profit divided by revenue. Selling, general and administrative expenses, store operating costs and other costs not included in the cost of goods sold have not yet been subtracted at this point. Which line a cost goes into can differ from company to company.
At the shop above, let's look only at the existing stores, leaving out the new ones. If last year's revenue was $100,000 and the cost of the goods was $65,000, gross profit was $35,000 and the margin was 35%. This year revenue rose to $105,000, but if the cost of the goods rose to $73,500, gross profit is $31,500 and the margin is 30%.
If operating costs at the existing stores were $20,000 in each of the two years, the operating profit left over was $15,000 last year and $11,500 this year. Revenue rose, yet profit fell. Many causes are possible, such as discounts, higher supplier prices or a change in the mix of products sold, so with a real company you need to check the explanation in its filings.
Nor should you decide that a company lacks competitive strength just because its gross margin is low. A shop that sells large amounts of low-priced goods and a premium brand run different kinds of business. Look at the same company's trend together with competitors in a similar business.
Look at inventory and sales channels too
Inventory is the goods a company holds in order to sell them. Building up inventory because you expect strong sales can be perfectly natural, but if unsold goods pile up, cash gets tied up and the company may need to sell at a discount.
If the shop above had $10,000 of inventory at the end of last year and $20,000 at the end of this year, inventory rose 100%. That is much higher than the 5% revenue growth, but you cannot conclude from this alone that there is a problem. It could be preparation for new stores or a difference in when goods arrived. Look at the product mix, the season and the size of discounts as well.
A sales channel is the route by which a product reaches customers. Running stores and online sales together makes it convenient for customers to get their goods, but delivery and returns cost money. The mere fact that online sales grew does not mean that profitability improved as well.
Consumer companies differ in which numbers to check
Let's compare the business structures of some real companies. The examples below are observations based on each company's published report for fiscal 2025 or fiscal 2026. They do not mean that what was true then is still true today.
| Company | What the business is like | First question to ask |
|---|---|---|
| Walmart | Sells many kinds of goods in stores and online | How have sales at comparable existing stores and online sales changed? |
| Costco | Earns income from both selling goods and membership fees | How have the number of members, the renewal rate and membership fees changed? |
| Nike | Sells products through its own stores and online, and through other retailers | How have direct sales, wholesale sales, discounts and inventory changed? |
For fiscal 2025, Costco cited new members and higher membership fees as reasons its membership fee income grew. Nike sells its products not only through its own stores and online but also through wholesale customers. When companies make money in such different ways, it is hard to compare them on revenue growth alone.
It is also hard to judge whether a brand is strong just from how well known its name is. Look over several periods at whether consumers keep buying after prices go up, how much discounting it takes to sell, and how the products differ from competing ones. Keep in mind, though, that changes in selling prices can also be affected by the product mix and by exchange rates.
Connecting this to investment decisions
When you read a company's results, separate total revenue from the revenue of the existing business, and find out whether the change came from the number of transactions, the average transaction value or sales volume. Then check whether margins and inventory moved in the same direction.
Even if a company runs good stores, good investment results are not guaranteed if the share price is too high. Compare the quality of the business, the growth you expect and the expectations already reflected in the current share price.
The key is not any single number but how the numbers connect. Looking together at whether there were more customers, how much is left from each sale and how much unsold stock has piled up helps you better understand what lies behind revenue growth.