
A company's profit grew compared with last year. Yet after the earnings release, its share price fell. Why?
Investors may already have expected even higher profit, or they may have read the company's business outlook differently. Many factors move a share price at once, so it is hard to pin it on a single reason. What matters is going one step beyond the result itself and looking at what was expected before the announcement.
How can you tell what the market expects?
People who analyze companies make forecasts of future revenue and profit. A figure that gathers these forecasts and summarizes them, as an average or in some other way, is often called the consensus estimate, or simply the market's expectation.
However, the firms that compile these forecasts can differ in which analysts are included, how the figures are aggregated and when they are updated. Nor does the number represent the views of every investor. Even with the same average, it means something different depending on whether analysts' forecasts are close together or widely spread.
Suppose that before the earnings release, three people forecast a hypothetical company's revenue for the same year at $100,000, $110,000 and $120,000. The simple average is the total of the three, $330,000, divided by 3, which is $110,000.
This average only summarizes three forecasts in one number. It does not explain why the highest and lowest forecasts differ. And because only three people take part in this example, you should not treat it as the view of the whole market.
Compare it with your own forecast
Suppose you also forecast the same hypothetical company's revenue for the same year before the earnings release, and your forecast is $120,000. The average of the three people calculated above is $110,000. Your forecast is $10,000 above the average. Measured against the average, that is (120,000 − 110,000) ÷ 110,000 × 100, or about 9.1% higher.
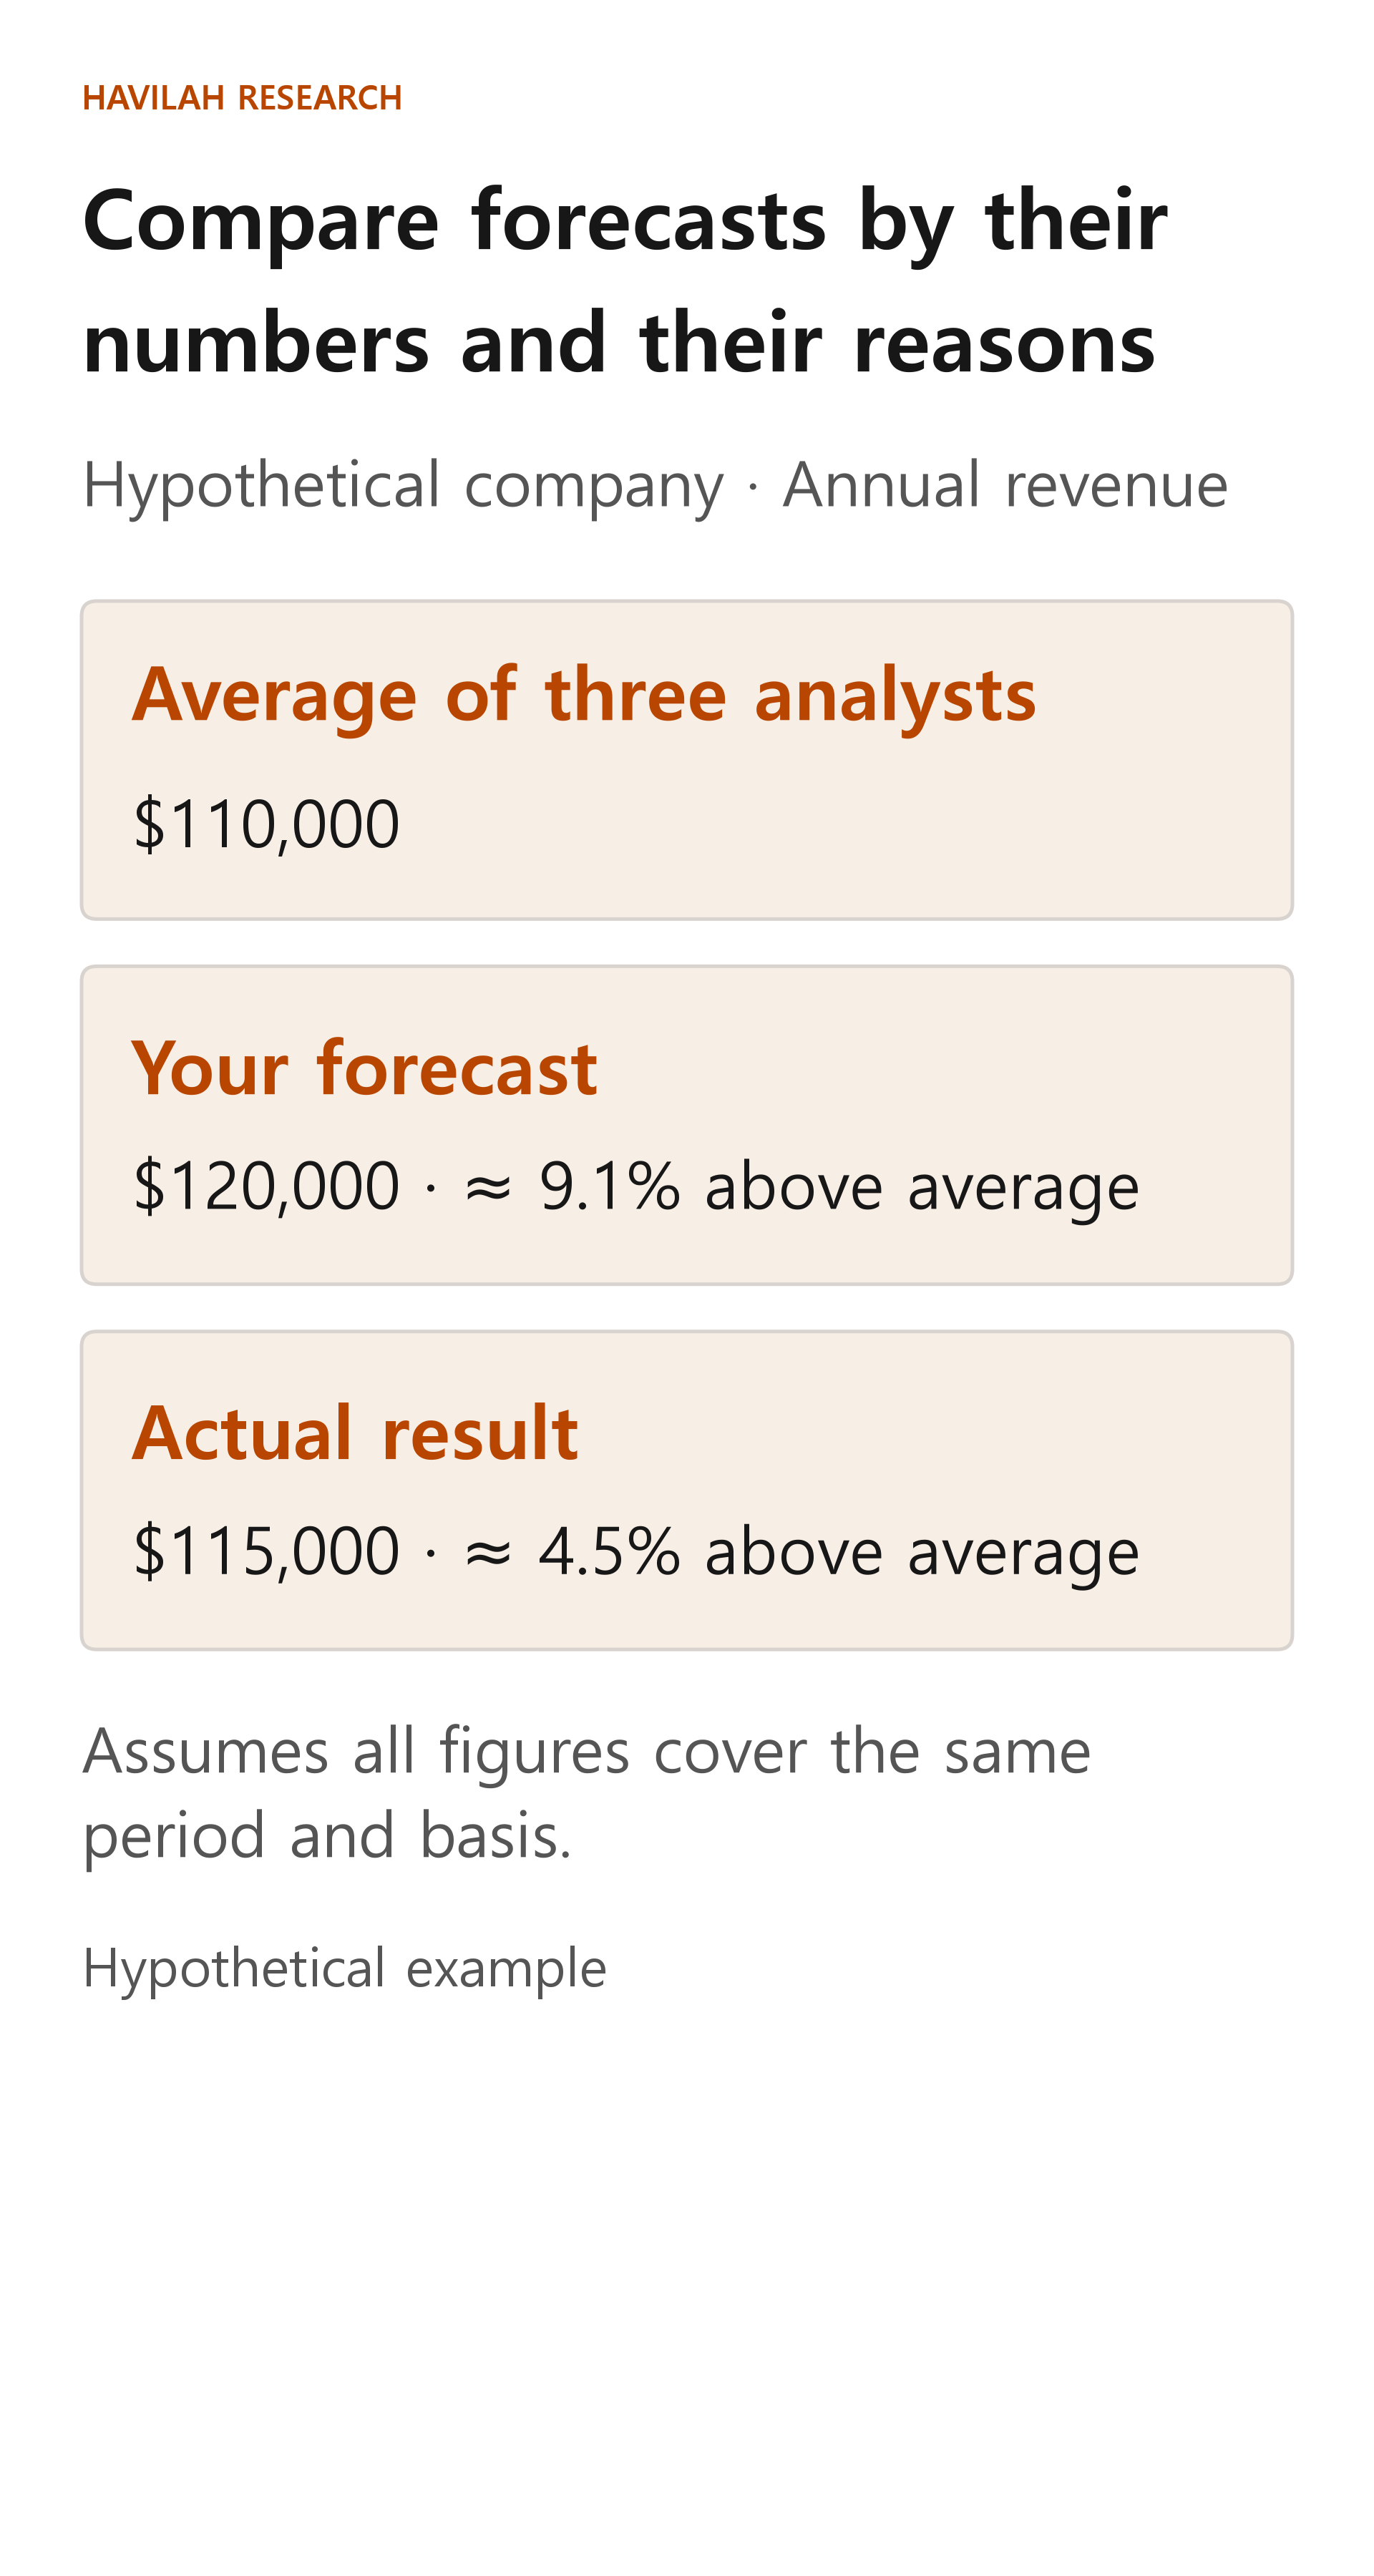
This difference alone does not make your forecast better. First, break down whether you expected more customers or higher selling prices. Check whether there is evidence that a new product will launch or that fewer customers will leave, and also how your forecast would change if supply ran short.
Compare your cost assumptions as well as revenue. For example, if you forecast operating income of $17,000 and the analysts' average is $15,000, your forecast is $2,000 higher, or about 13.3% above the average. Look at whether the gap comes from a difference in revenue or a difference in margins.
Put the numbers on the same basis before you compare
Even for the same company, you cannot directly compare a quarterly figure with an annual one. First check that the fiscal year, the currency (for example, U.S. dollars or your home currency) and the units of the amounts are the same.
When you compare profit, also check whether it is the profit the company reported under accounting standards or a profit figure adjusted for certain costs. For earnings per share, make sure both use the same basis: the basic share count or the share count that reflects potential dilution. If you mix different bases, the gap between forecasts can look bigger or smaller than it really is.
When the forecasts were collected and how many analysts took part also matter. If old forecasts are still in the average just before the earnings release, it is hard to compare them fairly with your own forecast, which reflects recent information.
When results come out, put forecasts and results side by side
Suppose the hypothetical company reports actual revenue of $115,000 for that year. That is $5,000, or about 4.5%, above the analysts' average of $110,000, but $5,000 below your forecast of $120,000. How you read the result depends on which forecast you compare it with.
A result above the average does not guarantee that the share price will rise. Investors may already have expected a figure higher than the average, the company may have lowered its outlook for the next quarter, or other important information may have come out at the same time.
Write down which of your assumptions about customer numbers, prices and costs differed from what actually happened. Even if you got the number right, if the reasons you expected differ from the actual reasons, you cannot be confident the same method will work next time.
Remember the difference between the price and the forecasts
The analysts' average is one reference point for future results. It does not show exactly what all investors expect, as reflected in the current share price. Forecasting higher than the average does not necessarily mean the stock is undervalued, either. You need to look at the current price, the risks and what happens if your forecast is wrong.
A good comparison does not end with "How many percent higher is my forecast?" You need to connect it to why the forecasts differ, what information can confirm the difference and what results would make you change your view.