
On the day a company released its results, revenue came in higher than expected. Yet the share price fell. Did you misread the numbers?
Not necessarily. Investors look at many things together: not only revenue but also profit, the outlook and the expectations already reflected in the share price. If you lay out, step by step, what changed from before the earnings release to after it, you are less likely to be pulled along by a single number.
Write down what you expected before the release
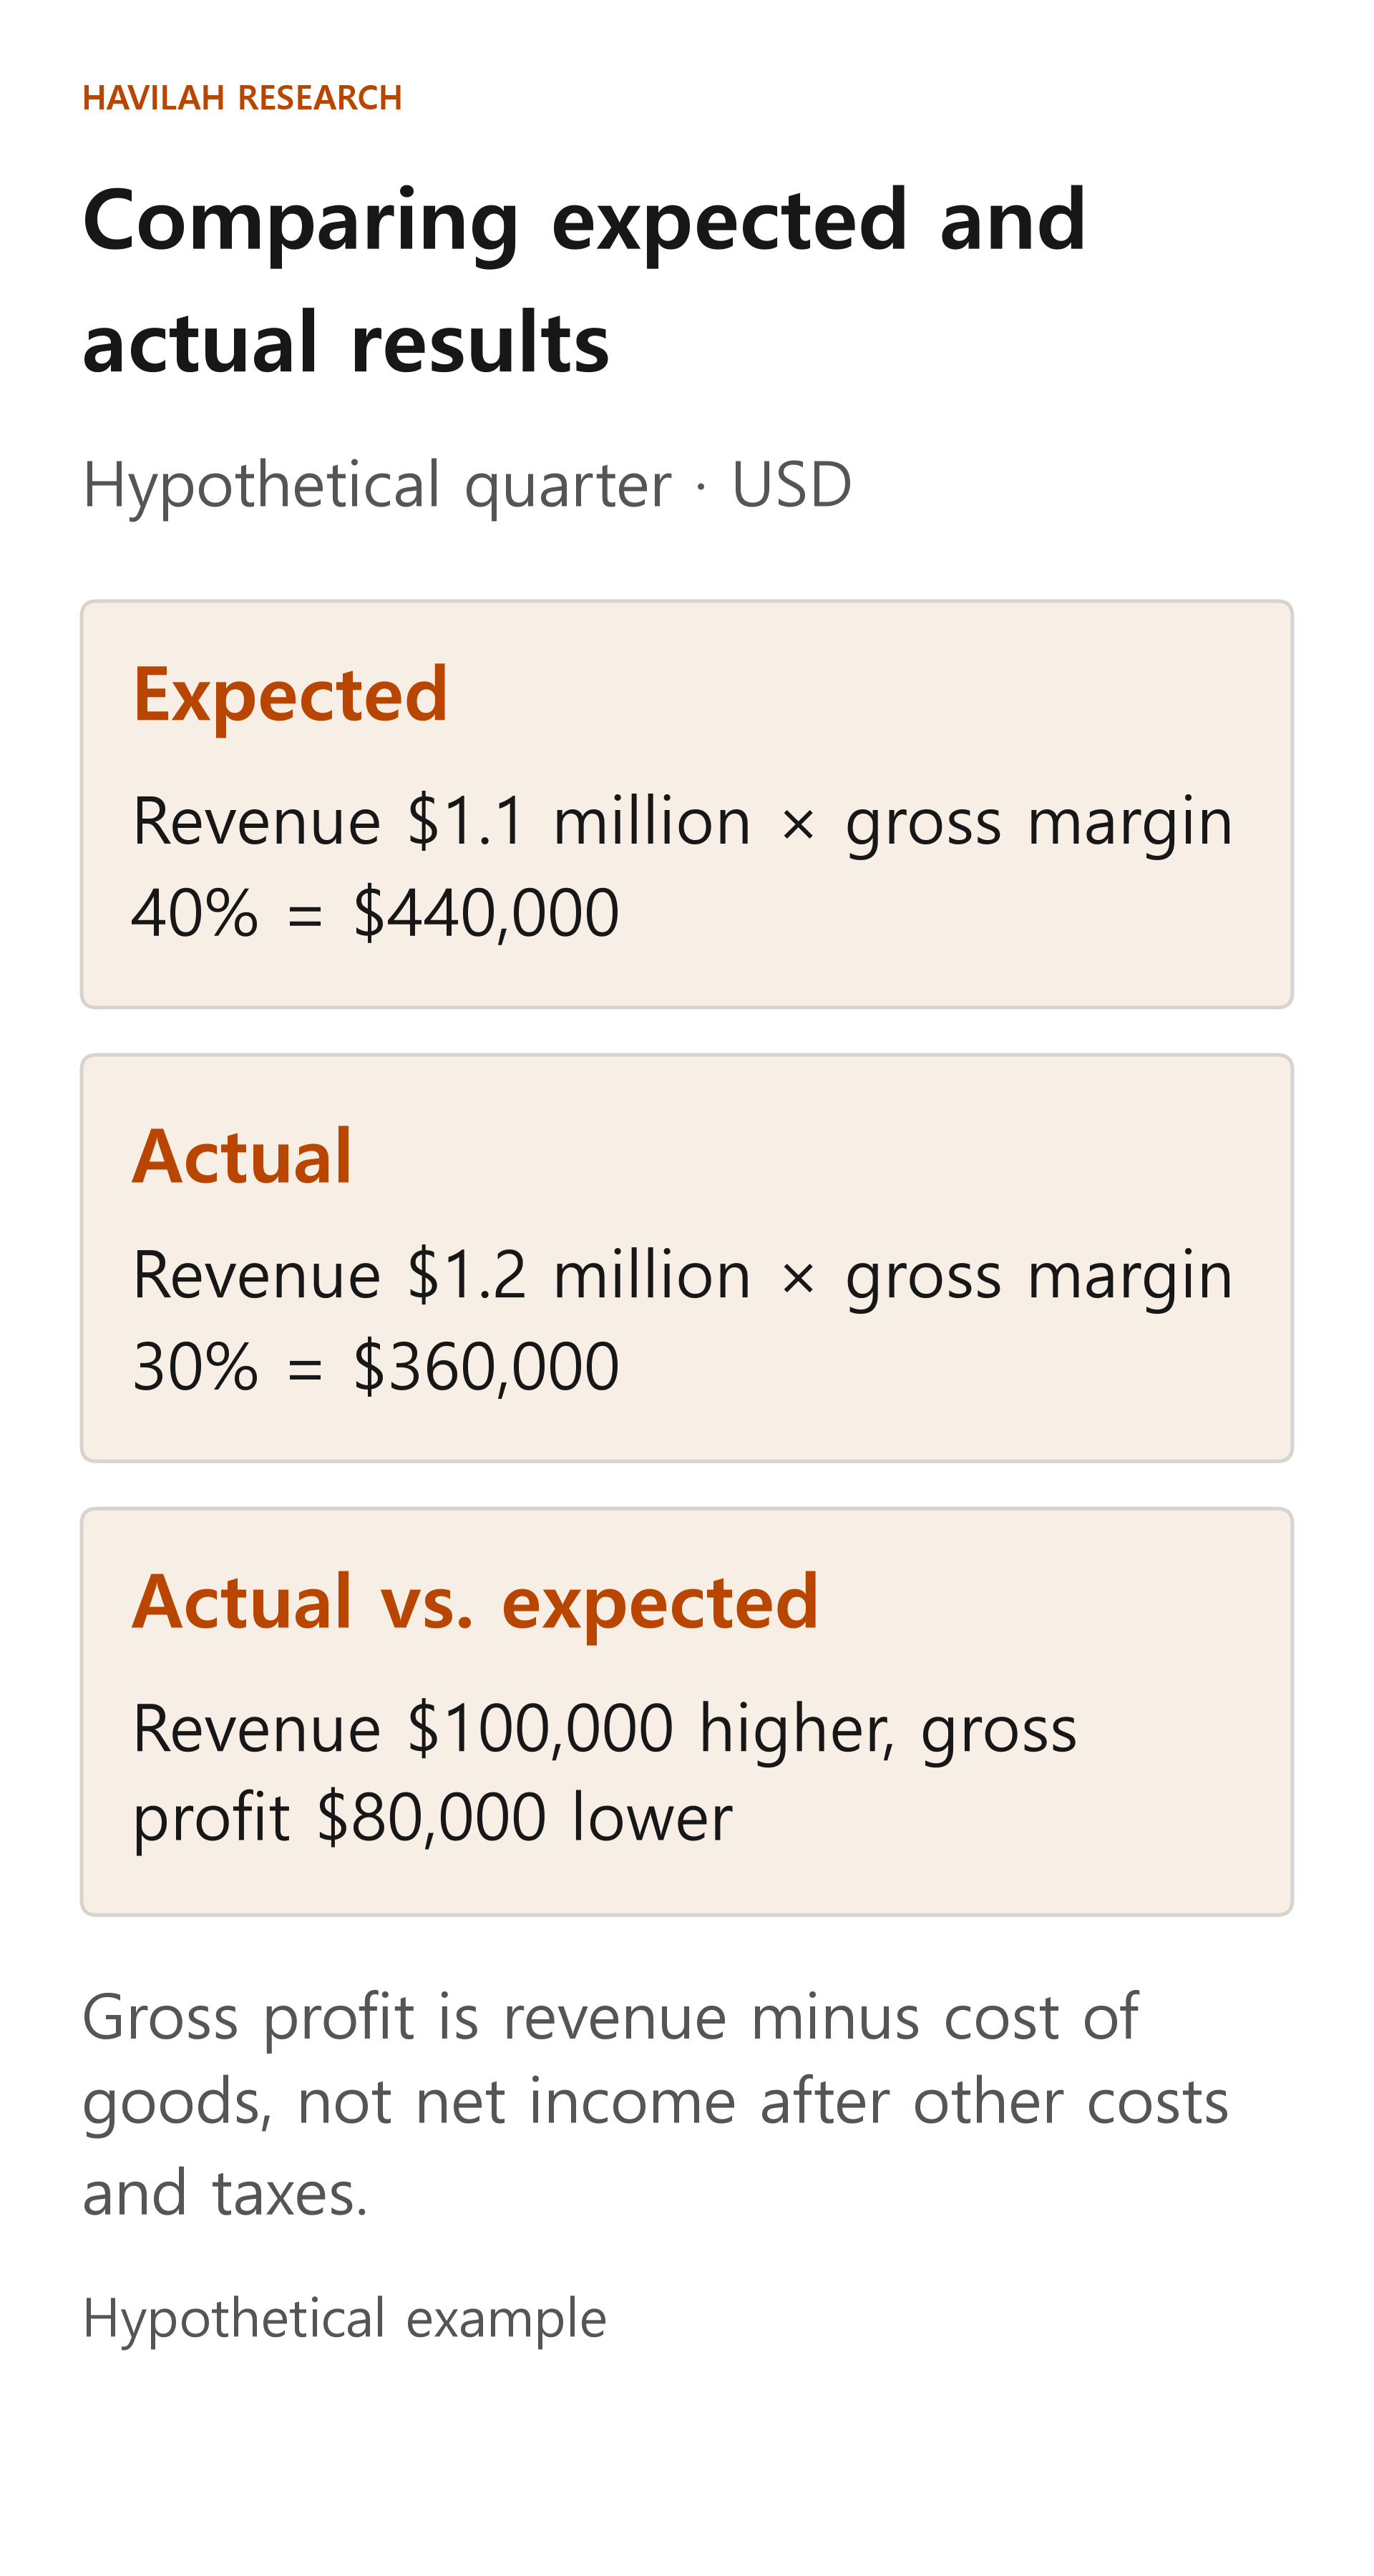
Suppose a hypothetical company has not yet reported its quarterly results. An investor expects this quarter's revenue to be $1.1 million and its gross margin to be 40%. Gross margin is what is left after subtracting the cost of providing the products and services from revenue, expressed as a percentage of revenue.
Under this assumption, expected gross profit is $1.1 million × 40%, or $440,000. Other costs, such as selling, general and administrative expenses, interest and taxes, have not been subtracted yet. So you should not think of the $440,000 as the net income the company will finally earn.
These numbers are one investor's hypothetical expectations. We do not assume they match the company's own outlook or the average forecast of analysts at brokers. When you make a comparison, also write down whose expectation it is, when it was made and which period it covers.
How did the actual results differ from the expectation?
Suppose the same hypothetical company reports quarterly revenue of $1.2 million and a gross margin of 30%. Actual revenue is $100,000 higher than expected. Measured against the expected $1.1 million, $100,000 ÷ $1.1 million × 100 is about 9.1%.
Actual gross profit, however, is $1.2 million × 30%, or $360,000. That is $80,000 less than the $440,000 expected. Revenue beat the expectation, but the amount left after subtracting costs was smaller than expected. Because the costs further down the income statement are not known, this calculation alone cannot tell you how much net income changed.
Find out why there was a difference
Check separately why revenue grew and why the margin fell. The company may have sold more units, but it may also have sold more lower-priced products, or higher raw material costs may have pushed the margin down. These are possible explanations, not confirmed causes for the hypothetical company above.
For a real company, look at the earnings release materials, management's explanation and the notes to the financial statements together. Check whether the reasons the company gives are temporary or could happen again, and whether it has given similar explanations before. If the company has not disclosed a specific cause, leave it marked as unconfirmed.
Compare the outlook separately
Suppose the hypothetical company had projected next quarter's revenue at $1.3 million before this release and changed that to $1.25 million in this release. The company's outlook for the same next quarter has fallen by $50,000. Measured against the previous outlook, that is $50,000 ÷ $1.3 million × 100, or about 3.8% lower.
This $1.25 million is the company's expectation for revenue that has not been earned yet. Keep it separate from this quarter's confirmed, reported result of $1.2 million. Also look at why the company changed its outlook, and check whether the basis for comparison, such as exchange rates or the number of business days, has changed.
There may also be an average forecast from analysts at brokers, but that is a different number from the company's outlook. The comparison is meaningful only after you check that it covers the same period and was made before the release.
Revise your view after seeing the share price reaction
Even when the share price rises or falls right after the release, it is hard to state the cause in a single sentence. The gaps in revenue and profit, the new outlook, interest rates and other news can all play a part. When you compare extended-hours prices with prices in the regular session, also keep in mind that the trading times and the size of the trades filled can differ.
Finally, rewrite your pre-release view in three lines: what you got right, what you got wrong and what you need to check next. For example, if you do not know yet why costs rose, leave it as a question to check in the next report or in the company's next explanation.
Updating your investment view does not mean you must trade every time results come out. Check how much the new information changes your existing view. If the evidence is not enough, waiting is also a decision.