
You hear that interest rates have gone up. Is that alone a reason to sell the stock of a company you are interested in? The fact that rates went up and how much that company's profit will change are two different questions.
Numbers that show the broad picture of the whole economy, such as interest rates, employment and prices, are called macroeconomic indicators. To use them in investing, you need to look at the paths through which they could affect the customers, costs and debt of the company you are interested in.
From economic news to a company's numbers
For example, when lending rates rise, customers may put off buying expensive products they would pay for in installments. If orders fall, revenue at the company that sells those products can fall. If the company itself has borrowed at a floating rate, its interest costs can also rise.
But not every step is bound to happen. If customers' incomes rise or demand for the product is strong, sales may hold up. If the company's loans are at a fixed rate, its interest may not change right away. Between an economic indicator and a company's results, there are conditions you need to check.
Connecting it to a hypothetical company
Suppose hypothetical Company A, which sells home appliances, sells 1,000 units over 1 year at $10 each. Revenue is 1,000 × $10 = $10,000. Each unit sold costs $6, and the costs that stay the same for a while even when sales volume changes are $3,000 a year.
The amount left from operations is then $10,000 − $6,000 − $3,000 = $1,000. We assume there are no other operating costs.
Now assume customers buy less, so sales volume drops to 900 units, while the price and the cost per unit stay the same. Revenue is 900 × $10 = $9,000, and the costs that depend on sales volume are 900 × $6 = $5,400. After subtracting the $3,000 of costs that stay the same, the amount left from operations is $9,000 − $5,400 − $3,000 = $600.
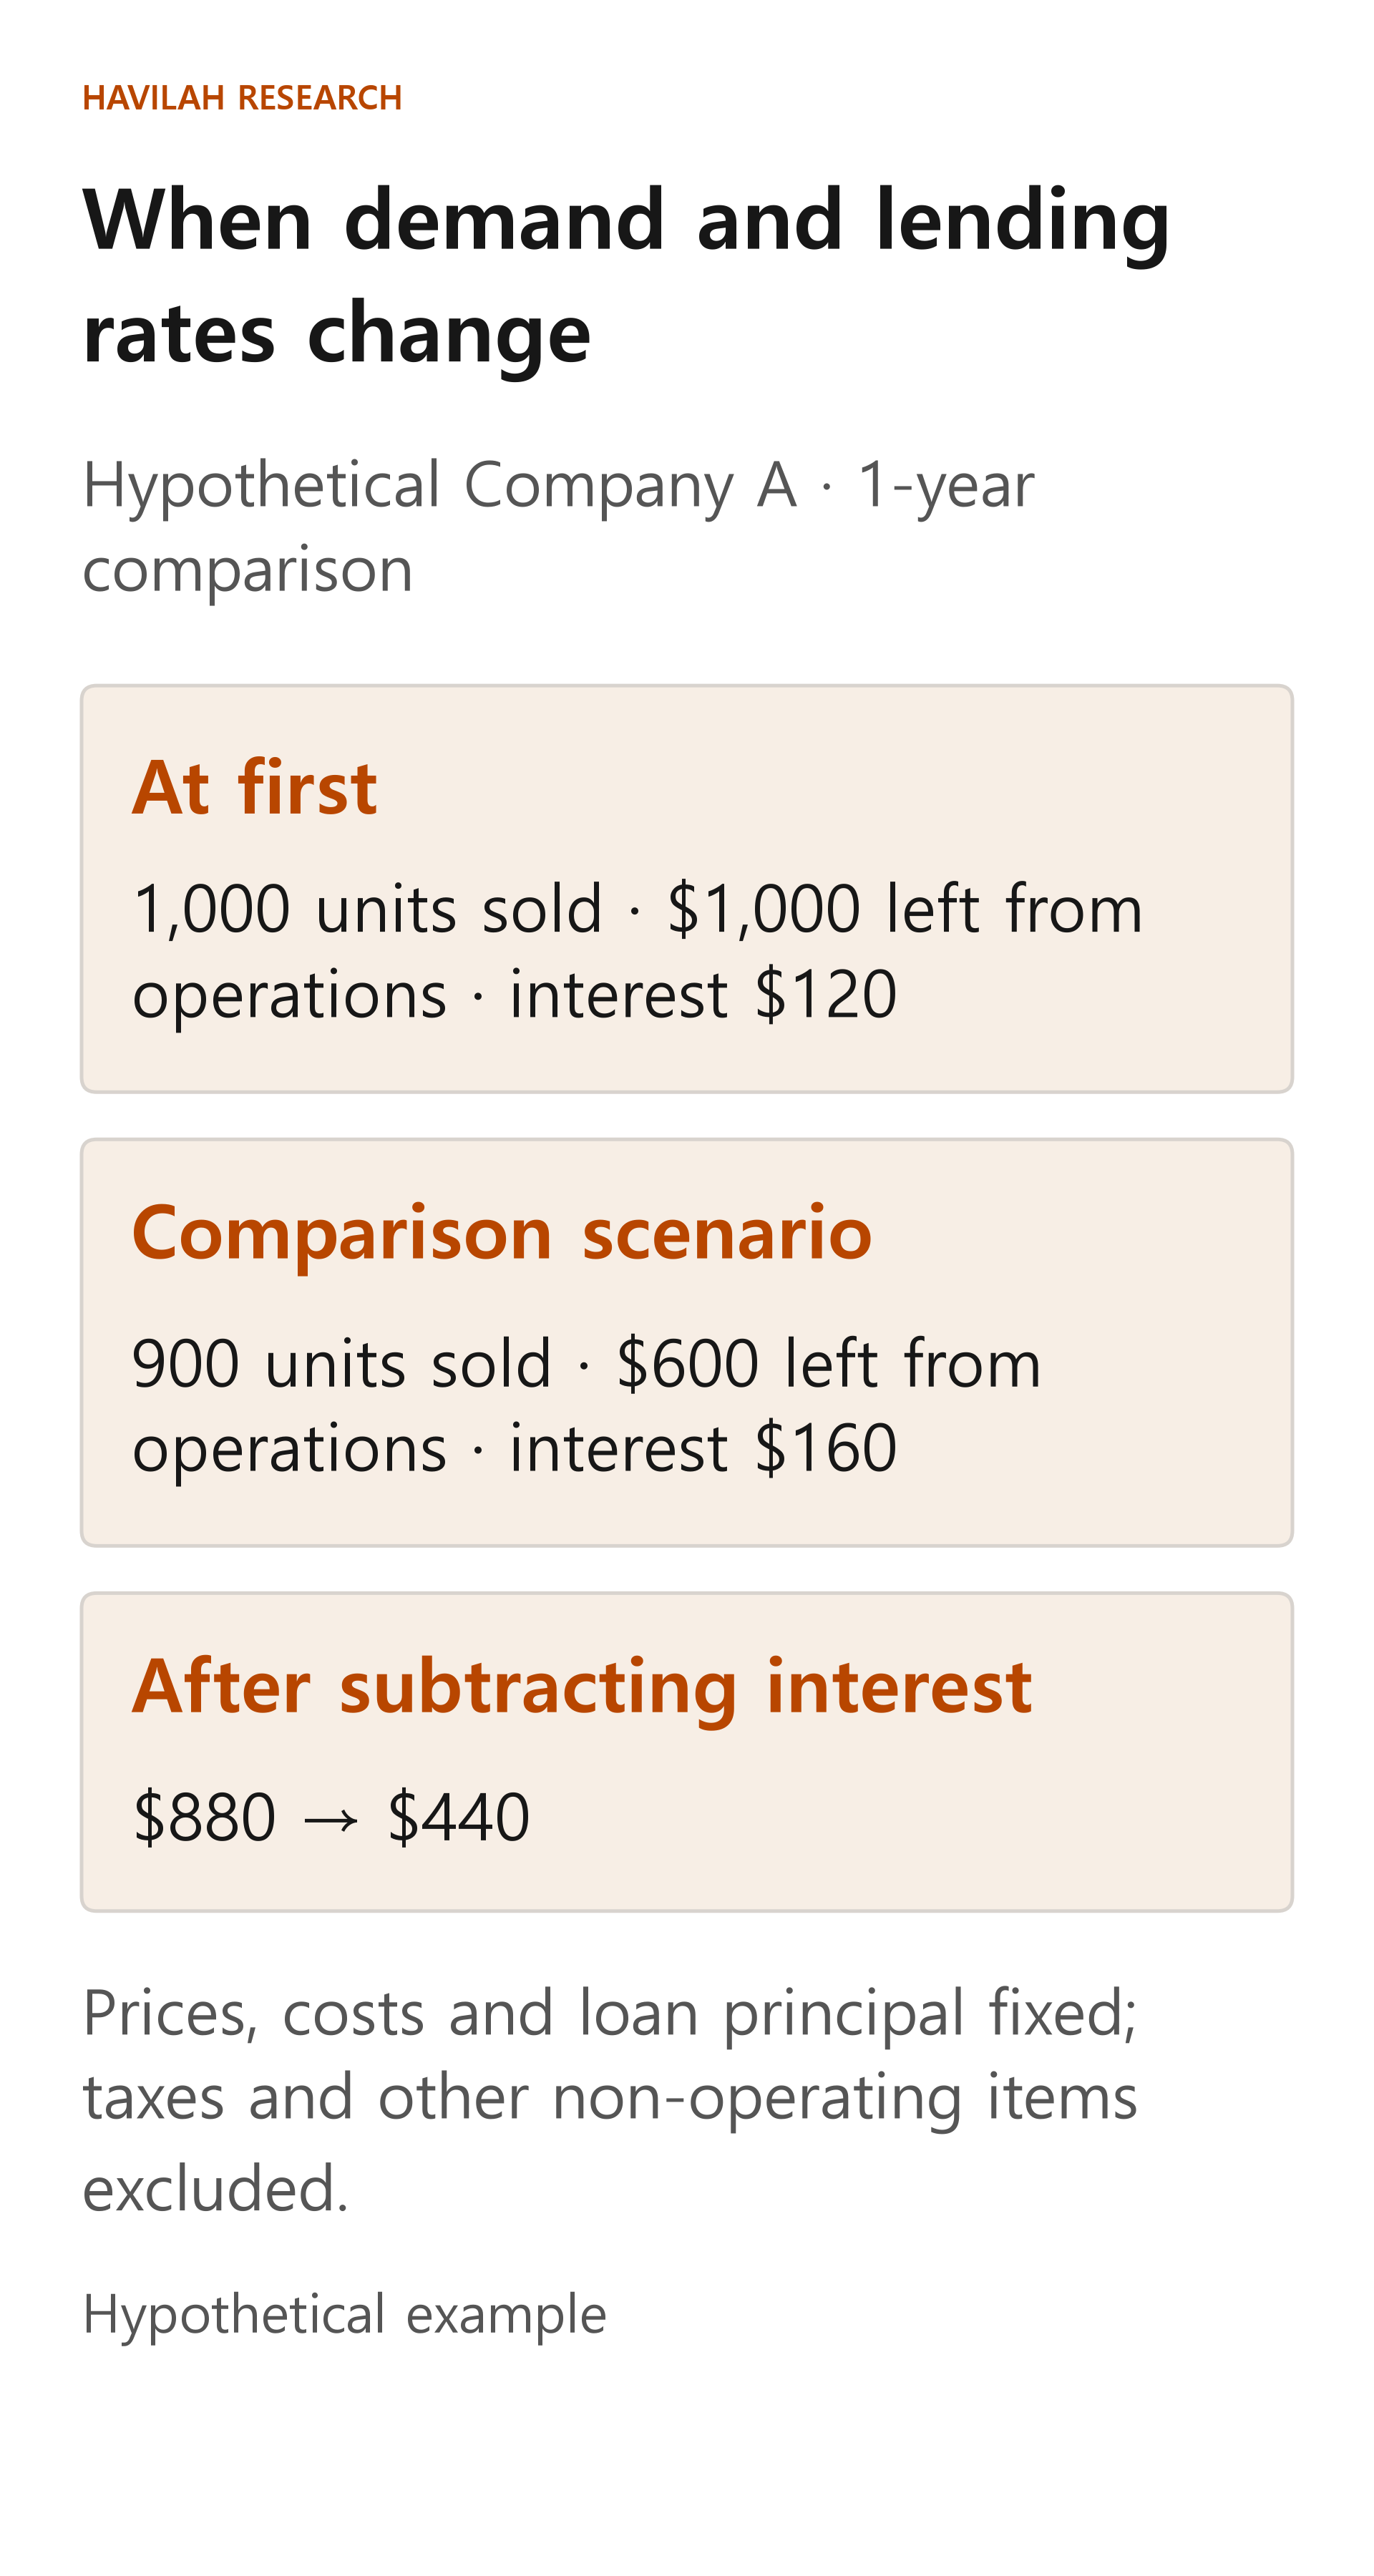
When revenue fell 10%, the amount left from operations fell 40%, from $1,000 to $600. That is because some costs do not fall right away when revenue does. This example does not mean that a particular change in interest rates will actually cut sales volume by 10%.
Adding the terms of the debt
Assume Company A has borrowed $2,000 of principal for 1 year, and that its original interest rate of 6% a year becomes 8% for the whole year in the comparison scenario. Simple interest is paid at maturity, and there are no fees.
The original interest is $2,000 × 0.06 = $120. In the comparison scenario, the interest is $2,000 × 0.08 = $160. Subtracting only interest from the amount left from operations gives $1,000 − $120 = $880 at first, and $600 − $160 = $440 in the comparison scenario.
These are simple amounts before taxes and other non-operating gains and losses. In practice, when a loan's rate resets and how its interest is paid can differ. Nor should you assume that a company's lending rate changes immediately by the same amount as the Fed's rate.
Would another company be affected the same way?
Suppose hypothetical Company B provides an essential business service for which customers pay a monthly fee, and that most of its debt was borrowed at fixed rates with maturities far in the future. In this case, its sales volume and interest costs may change less in the short term than A's.
That still does not let you conclude that B is safe. Customers could cancel their contracts or wages could rise, and the terms for new borrowing when its debt matures could also change. If it has a lot of revenue from abroad, you also need to look separately at the effect of currency conversion. Look for the differences between the two companies not just in their names or industries but in their actual contracts, customers and costs.
Keep changes in results separate from the stock's value
If a company's expected profit falls, the outlook for the cash that will go to shareholders in the future can change too. Meanwhile, the discount rate used to turn future cash into today's value can also change. The discount rate and expected cash are separate assumptions, so change each one on its own.
Share prices react not only to the indicators that are released but also to what the market expected beforehand, to other economic news and to the company's earnings outlook. So you cannot say that because the profit in the calculation above halved, the share price will halve too.
Map out your own paths of impact
Pick two companies you are interested in, and for each one write down who its customers are and how interest rates and exchange rates reach its revenue. Then check its main costs and the maturities and interest terms of its debt.
You can split the outlook into cases: demand and interest rates stay about where they are now, demand weakens, or things turn out better than expected. Write down which numbers you changed, and leave blank anything you have not been able to check. Macroeconomic indicators are not signals that hand you the answer; they are a starting point for questions that help you understand a company better.