
You look up two companies' operating margins: A's is 15% and B's is 10%. Is A the better investment? The numbers alone cannot tell you. A's figure might cover a full year while B's covers three months, and the two companies may also make money in different ways.
A comparison starts with putting numbers side by side, but you can only make a judgment after you have checked how those numbers were produced.
Use ratios to look at companies of different sizes
Operating income is the profit left after subtracting the costs of a company's core business from the revenue that business earned. The operating margin is the share of revenue that this profit makes up. It shows how much profit the core business makes for every $100 of revenue.
Suppose two hypothetical companies produced the following results over the same 1-year period. All amounts are in dollars.
| Item | Company A | Company B |
|---|---|---|
| Revenue | 1,000 | 500 |
| Operating income | 150 | 50 |
| Operating margin | 15% | 10% |
A's operating margin is 150 ÷ 1,000 × 100 = 15%. B's operating margin is 50 ÷ 500 × 100 = 10%. Measured against the same $100 of revenue, A kept $15 and B kept $10.
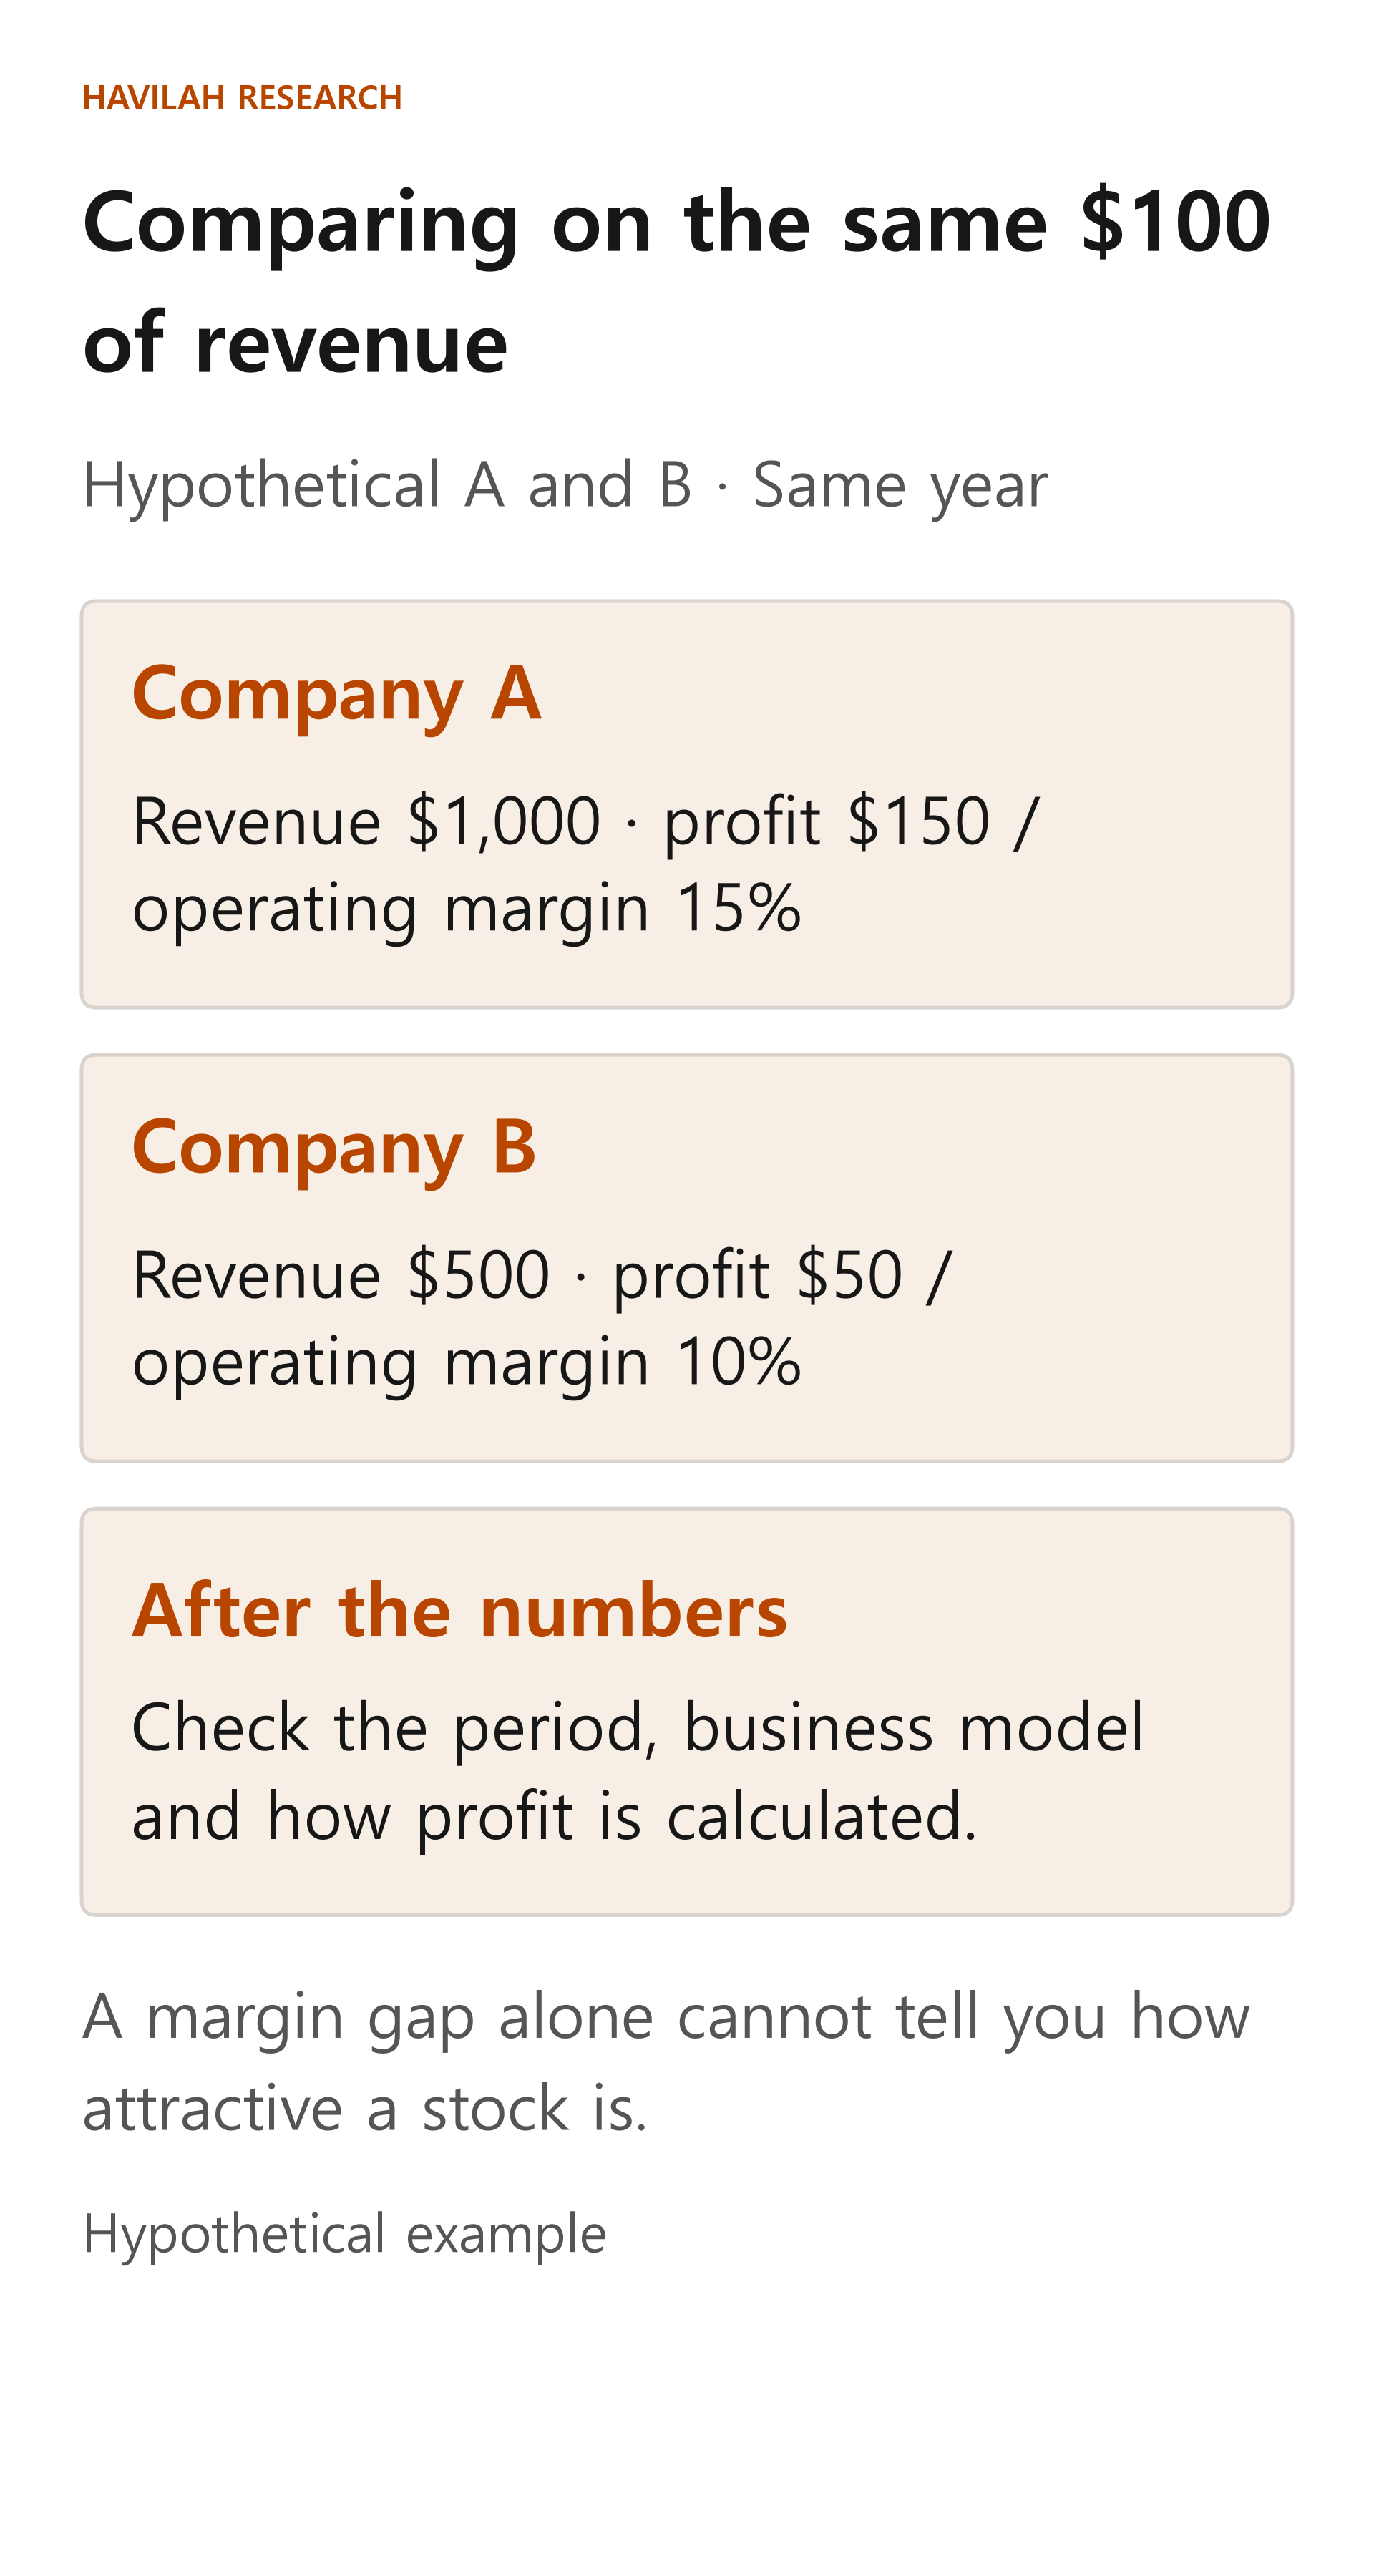
This ratio helps you compare companies of different sizes on a more equal footing. But it does not mean that A's shares are cheaper or that A will keep earning more profit in the future. It is a starting point for checking how much a company spent relative to its revenue.
First check that the periods and the items are the same
If you compare a 1-year operating margin with a 3-month operating margin, seasonal differences get mixed in. For a company that makes many of its sales at the end of the year, profitability in the year-end quarter can be higher than usual. Compare the same periods, and if needed, also look at the same quarter across several years.
Also check whether the reported operating income and revenue of the two companies were divided in the same way. Adjusted profit figures that a company presents separately may leave out costs it considers one-time, among other items. If you use reported profit for one company and adjusted profit for the other, it is hard to tell whether the difference comes from business performance or from the calculation method.
Even measures with the same name can be calculated differently. Walmart, for example, has stated that the way it calculates the return on investment it presents may differ from the way other companies calculate it. Before you compare numbers, look at how each company calculated its measures.
For example, if you add the $20 of costs that B excluded as one-time to B's reported operating income of $50, adjusted operating income is $70. Divided by the same revenue of $500, the adjusted margin is 70 ÷ 500 × 100 = 14%. Neither 10% nor 14% is automatically the right answer. Look at what costs were excluded and whether similar costs keep coming back, and keep the reported figures and the adjusted figures apart.
Even in the same industry, business models differ
One company may buy goods itself and sell them, while another may connect sellers with buyers and collect a commission. Even if both are in online shopping, the amounts recorded as revenue and the costs each one bears can differ. In that case, it is hard to conclude from margins alone which company is run better.
Start by checking what each company sells, who holds the inventory and where the money is spent. Where possible, compare segments that run similar businesses. But if the filings do not give enough figures for each segment, it is better to note that the difference cannot be calculated precisely.
Also look at differences in accounting and in the business cycle
Profit for the same period can differ depending on when and how a company records the cost of its equipment or inventory. Look for these differences in the explanation of accounting policies in the filings. To adjust the numbers, you need the underlying amounts and a method for the calculation. If the information is not there, do not force the numbers to match on your own.
The economy also has an effect. In industries where demand and supply swing widely, such as semiconductors, the margin in a boom year can be higher than usual. It is a good idea to check whether the companies you are comparing went through similar conditions at about the same time, and how their margins changed over several years.
From a comparison table to an investment decision
In your comparison table, write down revenue, reported operating income and operating margin for the same period, and make a note of how each was calculated. If you use adjusted figures, record separately what was excluded and why. Then also look at the business model, the main costs, debt and the level of the share price. A high margin alone does not decide how attractive an investment is.
Finally, ask why the difference exists. Check whether A's higher margin comes from a temporary price increase, from steady cost control, or simply from comparing two different kinds of business. If you cannot find the reason, keep it as a question for further research.