
One company's revenue grew 50%, and another company's grew 20%. Can you conclude right away that the first company grew more? Before you read a growth rate, first check which periods the numbers come from and what was compared with what.
A growth rate shows how much a number rose or fell compared with an earlier number. The same increase in dollars gives a different percentage when the starting point is different.
Growth rates divide by the earlier number
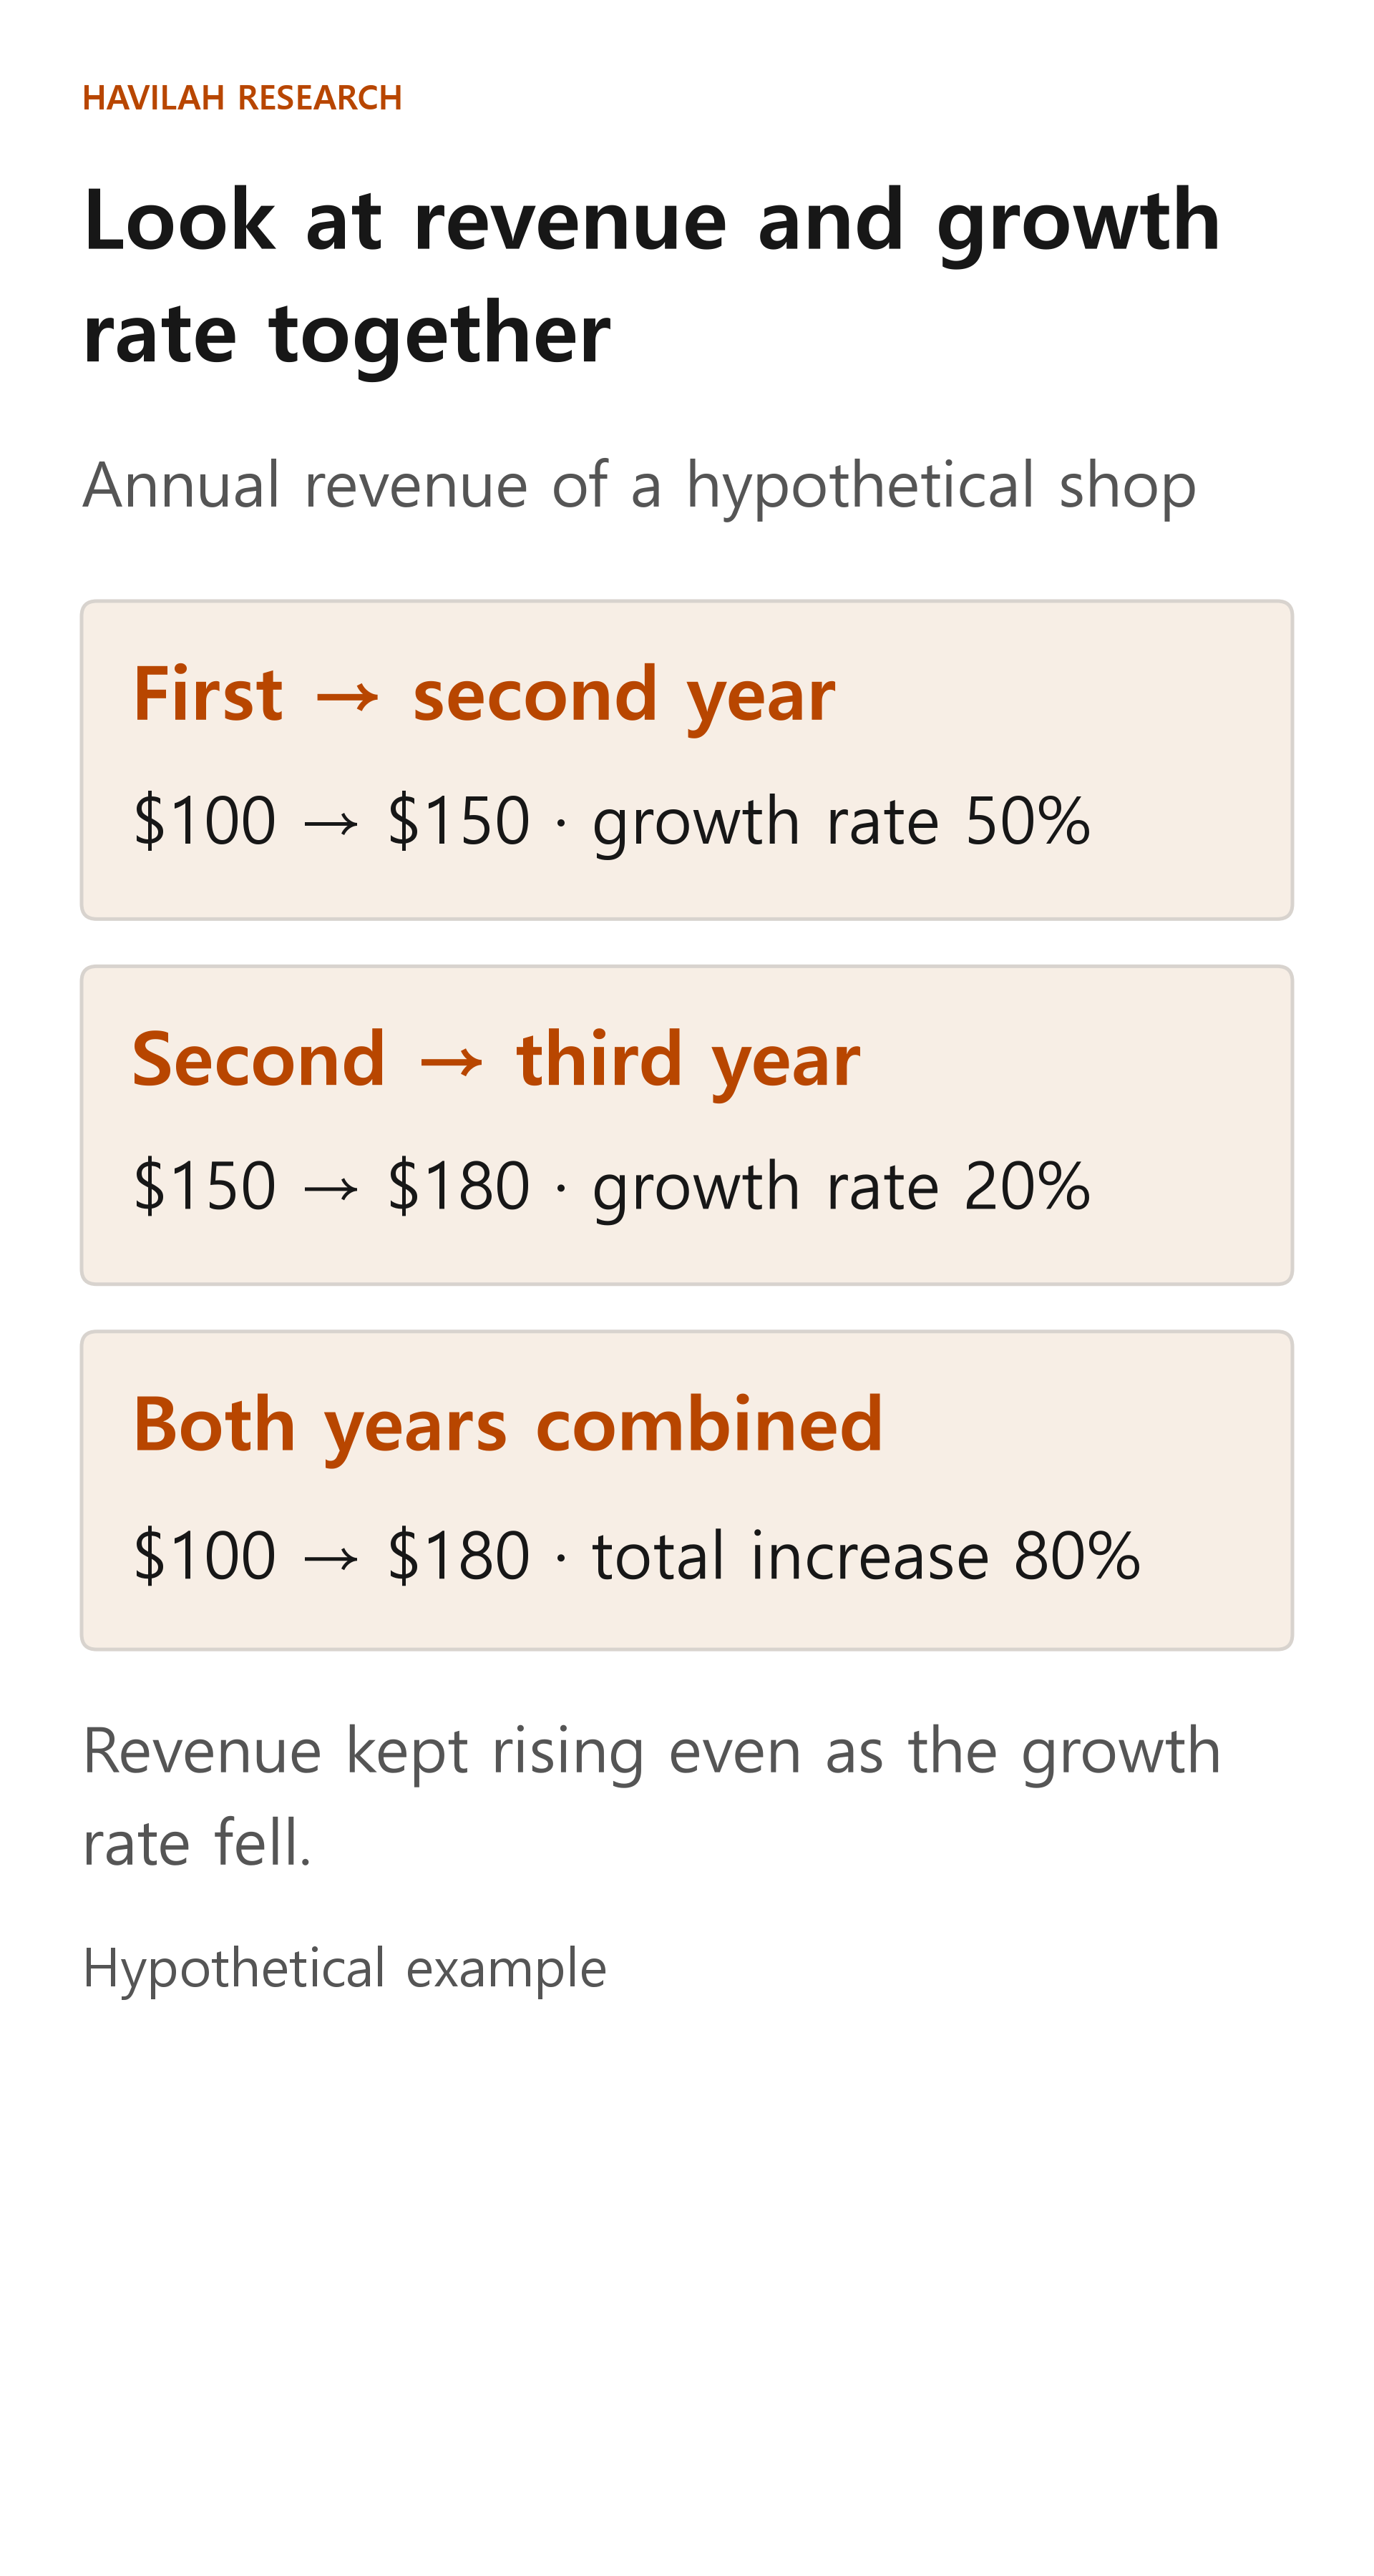
Suppose a hypothetical shop's revenue rose from $100 in its first year to $150 the next year. The increase is $50. Divide that $50 by the starting point of $100 and multiply by 100, and the growth rate is 50%.
The year after that, revenue reached $180. That is $30 more than the previous year's $150, so the growth rate is 30 ÷ 150 × 100, or 20%.
| Hypothetical annual revenue | Amount | Growth vs. previous year |
|---|---|---|
| First year | $100 | No earlier figure to compare |
| Second year | $150 | 50% |
| Third year | $180 | 20% |
The growth rate fell from 50% to 20%, but revenue still rose from $150 to $180. Growth slowing down is not the same as revenue itself falling.
The percentage depends on the starting point
If revenue goes from $10 to $20, it has risen by $10 and the growth rate is 100%. If revenue goes from $100 to $110, it has also risen by $10, but the growth rate is 10%. The increase is the same, but the starting points are different.
When you see differences like this, also check whether the earlier period was unusually low or high. For example, if revenue fell sharply for a while in the previous year, simply getting back to its normal level the next year can produce a high growth rate. To understand this, look at how the actual revenue amounts moved, not only at the percentages.
Compare the same kind of period
Year-over-year growth compares a quarter or a month with the same quarter or month a year earlier. Quarter-over-quarter growth compares a quarter with the quarter just before it. The two numbers use different bases, so do not read them as if they meant the same thing.
For example, if a shop's sales rise every year toward the end of the year, comparing Q4 with the Q3 just before it can mix in that seasonal effect. Comparing it with Q4 of the previous year as well helps you look at seasonality, but that comparison alone cannot explain every difference. You also need to check factors such as the number of business days, price changes and special promotions.
When you look at annual growth rates, too, do not compare a 1-year figure directly with a 3-month figure. Check that the periods are the same length, and check when the company's fiscal year ends.
Expressing several years of growth as one number
The hypothetical revenue above went from $100 in the first year to $180 in the third year. The total increase is 80%. From the first year to the second and from the second year to the third, there are two 1-year periods.
The compound annual growth rate (CAGR) is the rate at which $100 would become $180 if it grew by the same percentage in each of the two years. Divide 180 by 100, take the square root of the result, subtract 1 and multiply by 100, and you get about 34.16%. This is rounded to two decimal places.
This number is a summary that spreads the two years of growth evenly. It does not mean revenue actually grew 34.16% each year. The actual annual growth rates in this example were 50% and 20%.
What to look at when the numbers are unusual
If the earlier revenue was 0, you cannot divide by 0, so an ordinary growth rate cannot be calculated. When an earlier value was negative and then turned positive, as can happen with profit, a simple percentage can also mislead. In cases like these, it is better to explain first whether the company went from a loss to a profit and how much the actual amount changed.
Reported revenue growth can also be affected not only by sales in the existing business but also by revenue from acquired companies and by changes in exchange rates. In its fiscal 2025 filing, the financial data company FactSet explained its total revenue growth by breaking it down into its existing business, acquisitions and exchange-rate effects. FactSet stated that its separately calculated organic revenue excludes the effects of acquisitions and dispositions within the last 12 months and of exchange-rate movements. When a company presents a growth measure of its own, check how it is calculated as well.
Next to any growth rate, try writing down answers to three questions. Are the periods being compared the same? How large was the starting amount? Did the increase come from selling more, or did other factors such as acquisitions or exchange rates play a part?
If you look at the amounts and the causes, not just the percentages, you can ask sharper questions about how long the growth might last.