
A company's revenue fell from the previous quarter. Reading the news, you might feel that the business has gotten worse. But compared with the same quarter last year, the same company's revenue may have grown.
It is not a question of which number is right. Each answers a different question, depending on what it is compared with. When you look at quarterly results, check the comparison period first, not just the numbers.
How do quarter-over-quarter and year-over-year comparisons differ?
A quarter-over-quarter comparison sets this quarter against the one just before it. If the first quarter of this year followed the fourth quarter of last year, it puts those two periods side by side. It helps you see what changed over the past few months.
A year-over-year comparison sets this quarter against the same quarter last year. For the first quarter of this year, the base is the first quarter of last year. Its advantage is that you compare results from a similar season. But being in the same season does not mean every condition is the same.
In its annual report, the U.S. retailer Target explained that a larger share of its sales tends to fall in the fourth quarter, which includes the year-end holiday shopping season. For a company whose customers crowd in at year-end, a drop in revenue in the next year's first quarter compared with the quarter just before cannot, on its own, be called unusual.
Comparing with hypothetical numbers
Suppose a hypothetical company's revenue was $80 in Q1 last year, $150 in Q4 last year and $100 in Q1 this year. Assume the three quarters are the same length and that revenue is counted on the same basis.
| Comparison | Base revenue | Q1 revenue this year | Change |
|---|---|---|---|
| Versus the previous quarter | $150 | $100 | Down about 33.3% |
| Versus the same quarter last year | $80 | $100 | Up 25% |
The quarter-over-quarter change is calculated by subtracting the base of $150 from $100 and dividing the difference, -$50, by $150. That is about -33.3%.
Year over year, you subtract the base of $80 from $100 and divide the $20 difference by $80. The result is a 25% increase. The quarter-over-quarter figure is rounded to one decimal place.
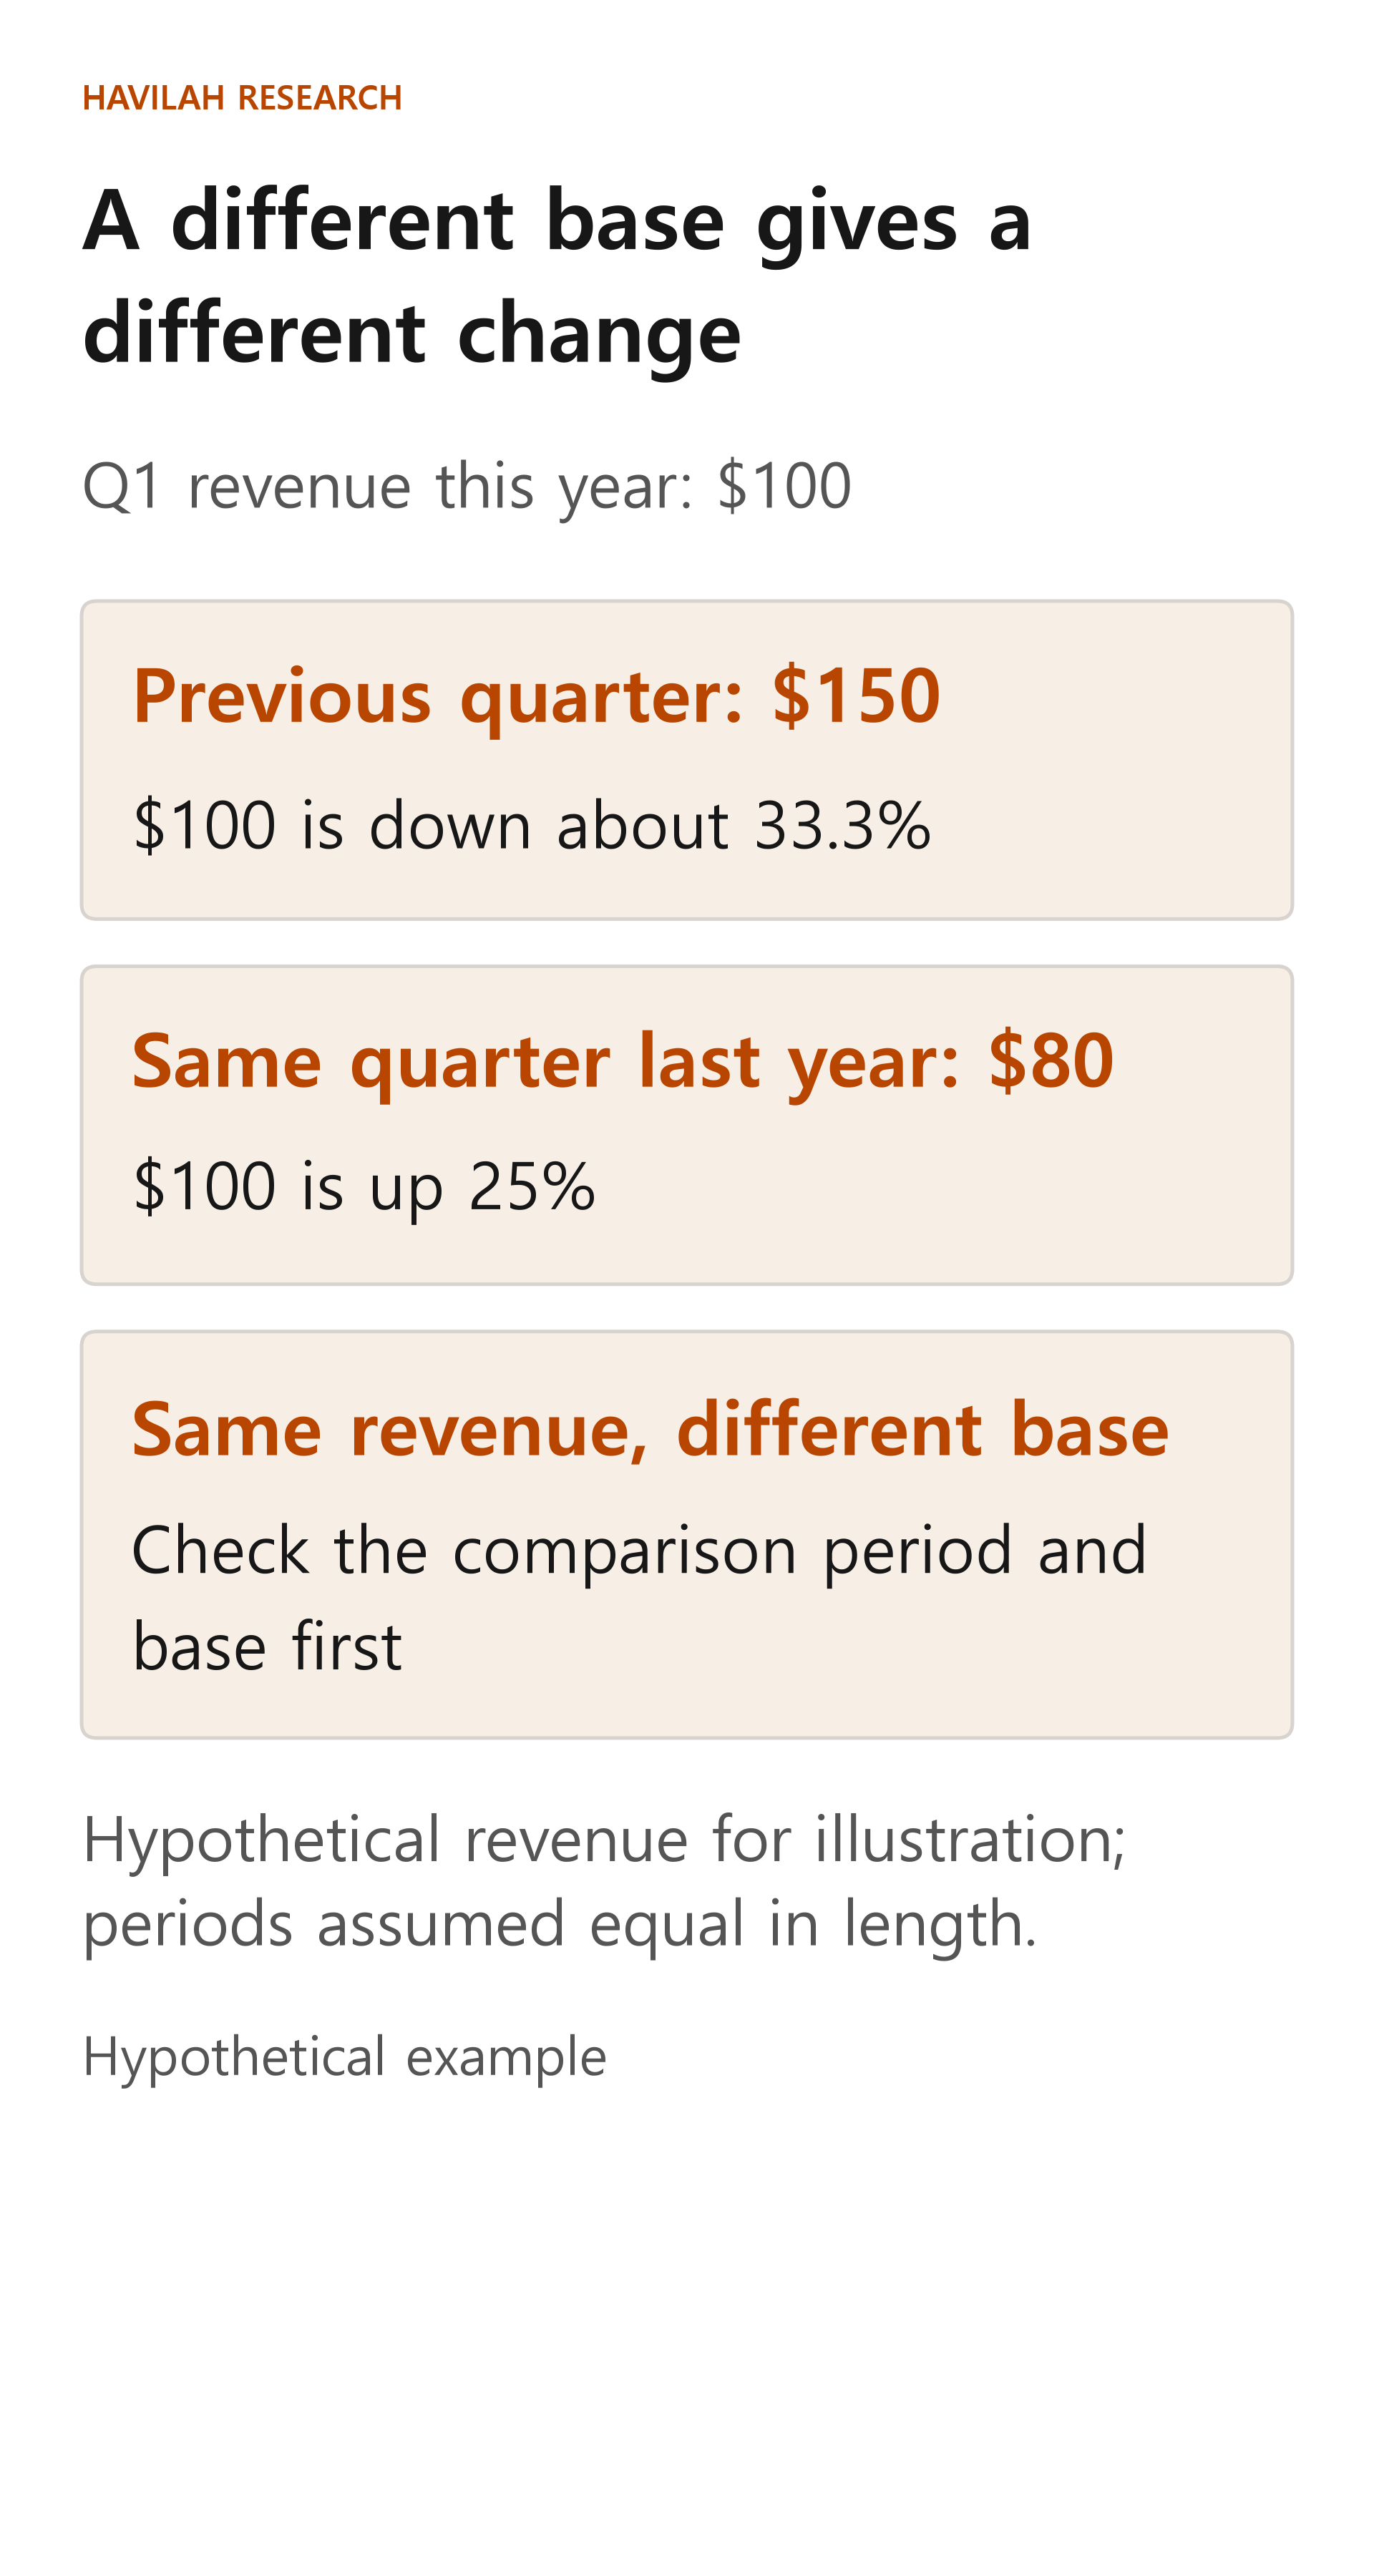
Both results are true at the same time: revenue is down from the previous quarter and up from the same quarter last year. Seasonality can be one explanation, but these numbers alone cannot confirm the cause. You also need to look at other factors, such as changes in the number of stores, prices or the number of customers.
Check the length of the period and the basis
A company's fiscal year does not always run from January to December. Even quarters can differ in their start and end dates and in the number of weeks they include. For example, some companies include 14 weeks in the last quarter of certain years. If a period is longer, check separately whether sales per day or per week actually improved, even if revenue went up.
Also, the results for a single quarter are different from the cumulative results from the start of the year through that quarter. If you compare 3 months of revenue directly with 6 months of revenue, the difference in length can lead you to the wrong conclusion. Read the table's title, period and currency unit first.
If a company has acquired another business, revenue from the newly added business can affect the increase. When exchange rates change, the numbers can also shift as the results of overseas operations are converted into the reporting currency. Check the comparison explanations the company provides as well.
What should you look at after revenue?
Even when revenue grows, margins can fall. Carry on with the income statement items from the earlier lessons: check whether there were price discounts or rising costs, and how advertising and development spending changed. These are the things you miss if you compare only the single revenue line.
U.S. companies' quarterly reports (10-Q) compare the quarter's results, and the year-to-date results, with the same periods of the previous year. However, companies based outside the United States may file different forms, so check which document the company actually filed and which period it covers.
Finally, how results changed and what the market expected in advance are different questions. Even a company that grew from the previous year may see its share price react differently after the announcement if the market had expected stronger growth. Compare numbers for periods of the same length, and look separately at the reasons for a change and at expectations.