
A company's revenue has grown sharply from last year. Is that because its products sold well? It could also be because it bought another company, or because exchange rates changed.
Instead of looking only at the growth rate, break down what drove revenue up. Then you will see the questions you need to check in the next set of results.
How much did the existing business sell?
Suppose a hypothetical company sold 100 units of a product last year at EUR 10 each. Revenue was EUR 1,000. This year it raised the price to EUR 11 and sold 120 units. Revenue from the existing business is EUR 1,320. Assume there are no discounts or returns, and that each year's sales are recognized as revenue in that year.
If you apply this year's price to last year's volume, you get 100 units × EUR 11 = EUR 1,100. On this basis, the price change accounts for EUR 100, and selling the extra 20 units at this year's price accounts for EUR 220. Together, revenue from the existing business rose by EUR 320.
When price and volume change at the same time, how much of their combined effect you assign to each can depend on the order of the calculation. Here, we changed the price first and applied the extra volume afterward. The total increase is the same either way.
Revenue from a newly acquired company may be included
Suppose this hypothetical company acquires another company this year and reports an additional EUR 100 of revenue from it. Assuming this amount falls within the reporting period after the acquisition and excludes transactions between the two companies, total revenue this year is EUR 1,420.
It is true that the acquired business adds revenue. But because a business that was not in last year's numbers has come in this year, you cannot say that sales of the existing products rose by that much just because total revenue went up. You also need to check when the acquisition took place and which period is included.
Some companies separately show the change in their existing business, excluding the effects of acquisitions and exchange rates. This is often called organic growth, but the calculation can differ from company to company, so read the reconciliation table to see which items were excluded.
When exchange rates change, the reported numbers change too
Suppose the company above earns its revenue in euros but reports its results in U.S. dollars. Say that last year EUR 1 was worth $1, and this year EUR 1 is worth $1.05.
Last year's EUR 1,000 is $1,000, and this year's EUR 1,420 is $1,491. This is a simple calculation that applies the same hypothetical exchange rate to the whole year's revenue. In dollars, revenue rose by $491, or 49.1%.
If you convert this year's EUR 1,420 of revenue at last year's exchange rate, you get $1,420. So in this example, the part of the increase that comes from applying this year's exchange rate is $71. In practice, it is not calculated this simply, because the timing of revenue and each company's conversion method can differ.
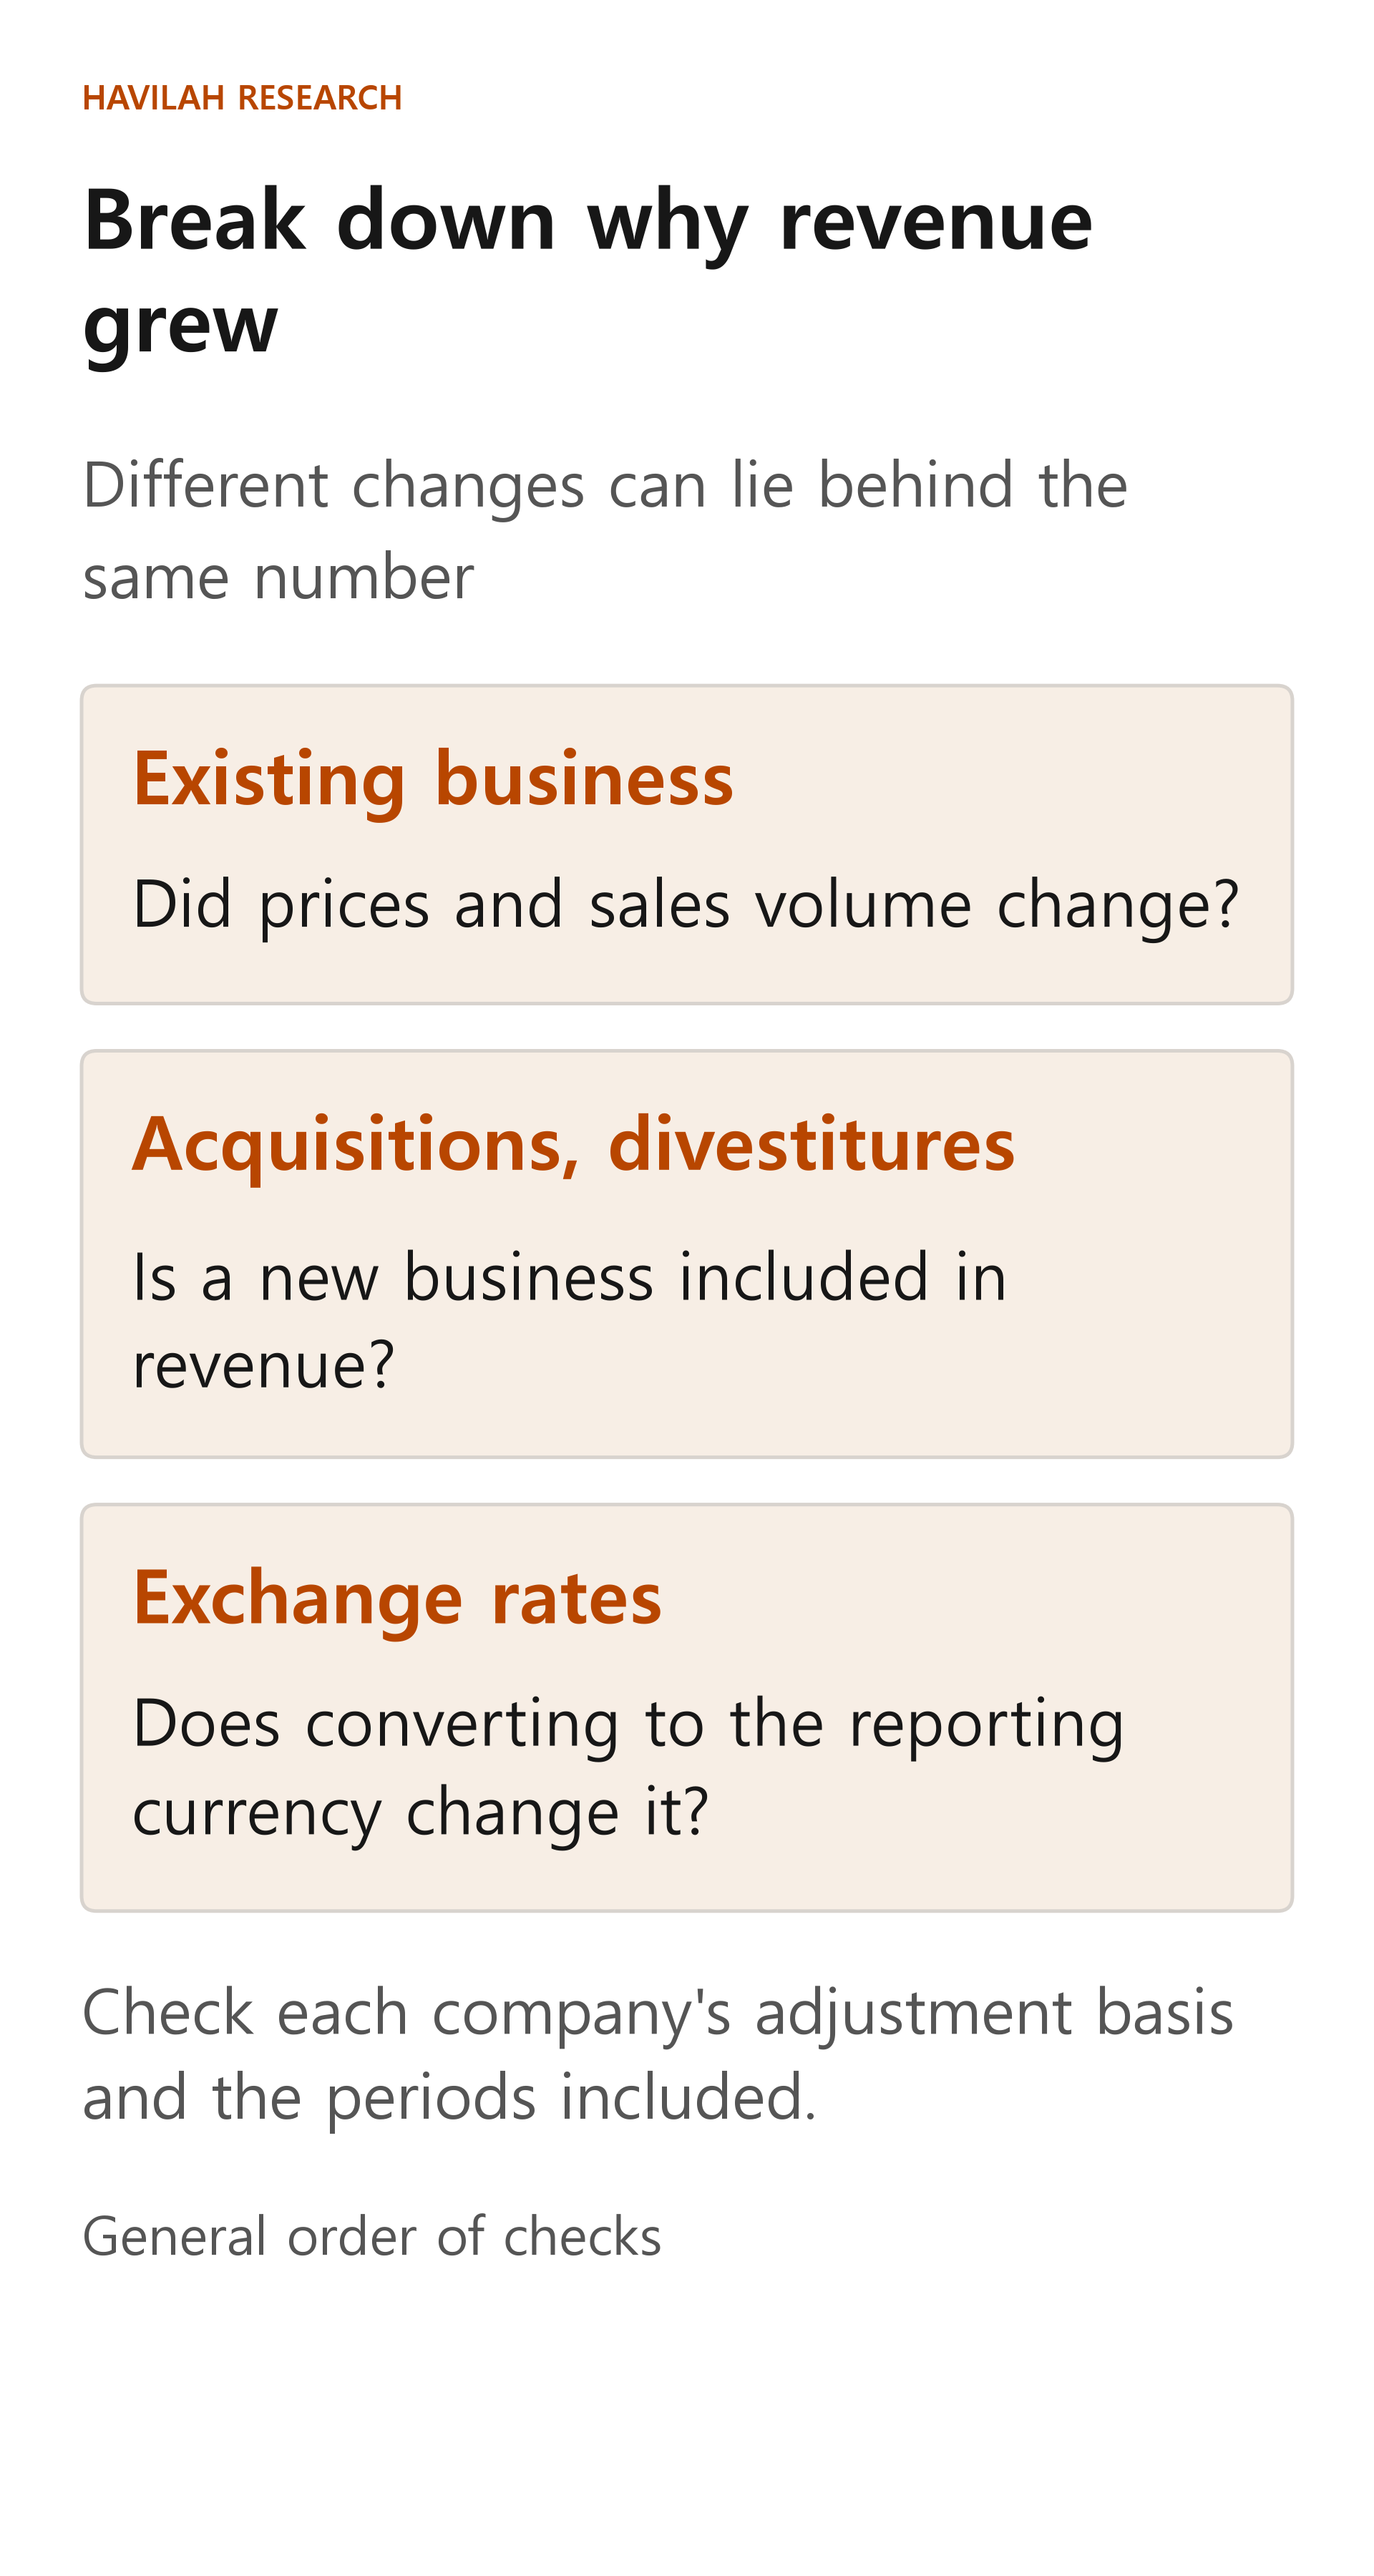
What should you check when you read results?
Look in the company's report for explanations of the prices and sales volumes of its existing products. If it has recently acquired or sold a business, also check from when, and for which period, that business's revenue is included. If the company has large overseas sales, see whether it explains the effect of exchange rates separately.
For a real example, the U.S. company Dover, in its 2025 annual report, explained its change in revenue by breaking it into the effects of its existing business, acquisitions, divestitures and exchange rates. A breakdown like this helps you understand why revenue changed. But check the company's own categories and calculation basis directly in the report.
Finally, see whether costs rose along with revenue. Even if prices go up, profit may not grow as much as expected if costs rise faster or sales volume falls. The growth rate is a starting point. The reasons for the growth are the information you need for your next decision.