
You hear that a company's revenue rose 10%. Did customers buy more, or did prices go up? The outlook can be different in each case.
The first step in understanding revenue is to break it down: what was sold, how much of it was sold, and how much the company received for it.
Multiply sales volume by price
Suppose a hypothetical shop, which prices its goods in Korean won (KRW), sells 100 cups at KRW 10,000 each. Assuming there are no discounts or refunds and the sales are counted in that period, revenue is KRW 1 million.
100 cups × KRW 10,000 per cup = KRW 1 million.
The next month, the shop keeps the price the same and sells 120 cups. Revenue is KRW 1.2 million, up KRW 200,000. This is because sales volume rose 20%.
Now suppose instead that the shop sells 100 cups, not 120, and only raises the price to KRW 12,000. Revenue is again KRW 1.2 million. The result is the same, but the reason for the increase is different. Whether customers keep buying after a price increase is something you have to check separately.
In reality, a company sells at many different prices, and there can be discounts and returns. When you look at total revenue, also check that the net revenue the company reports and the sales volume it gives cover the same scope.
When more expensive products sell more, the average price changes
If the hypothetical shop sells 50 cups at KRW 10,000 and 50 cups at KRW 20,000, revenue from the 100 cups is KRW 1.5 million. If the next month it sells 25 cups at KRW 10,000 and 75 cups at KRW 20,000, sales volume is the same 100 cups, but revenue is KRW 1.75 million.
The prices of the two products did not change, yet total revenue changed because the more expensive product made up a larger share of sales. A change like this in what is sold is called a change in product mix. It is why, when you hear that the average selling price went up, you should not assume that the price tag on every product went up.
There are real examples too. Coca-Cola Consolidated, a U.S. beverage company, explained in its 2025 report that a higher average selling price and a shift in its sales mix toward relatively more expensive products contributed to its revenue growth. This is the company's own explanation for that period. It does not mean the same reasons apply to every beverage company.
Some businesses charge for what customers use
Instead of selling one product at a time, a service company may charge according to how much customers use. For example, the fee may depend on how much storage space a customer uses or how many parcels the customer ships.
If a hypothetical service charges KRW 200 per unit of usage and a customer uses 1,000 units, the fee, by simple arithmetic, is KRW 200,000. If the same customer's usage rises to 1,500 units, the fee becomes KRW 300,000. Both amounts assume that the usage is recognized as revenue in that period and that there are no discounts or extra charges.
Even if the number of customers does not grow, revenue can rise if existing customers use more. Conversely, revenue can fall if customers use the service less or the fee per unit goes down. Real contracts may include a base fee or a minimum usage commitment, so look at how the contracts are structured as well.
Which numbers should you check when you invest?
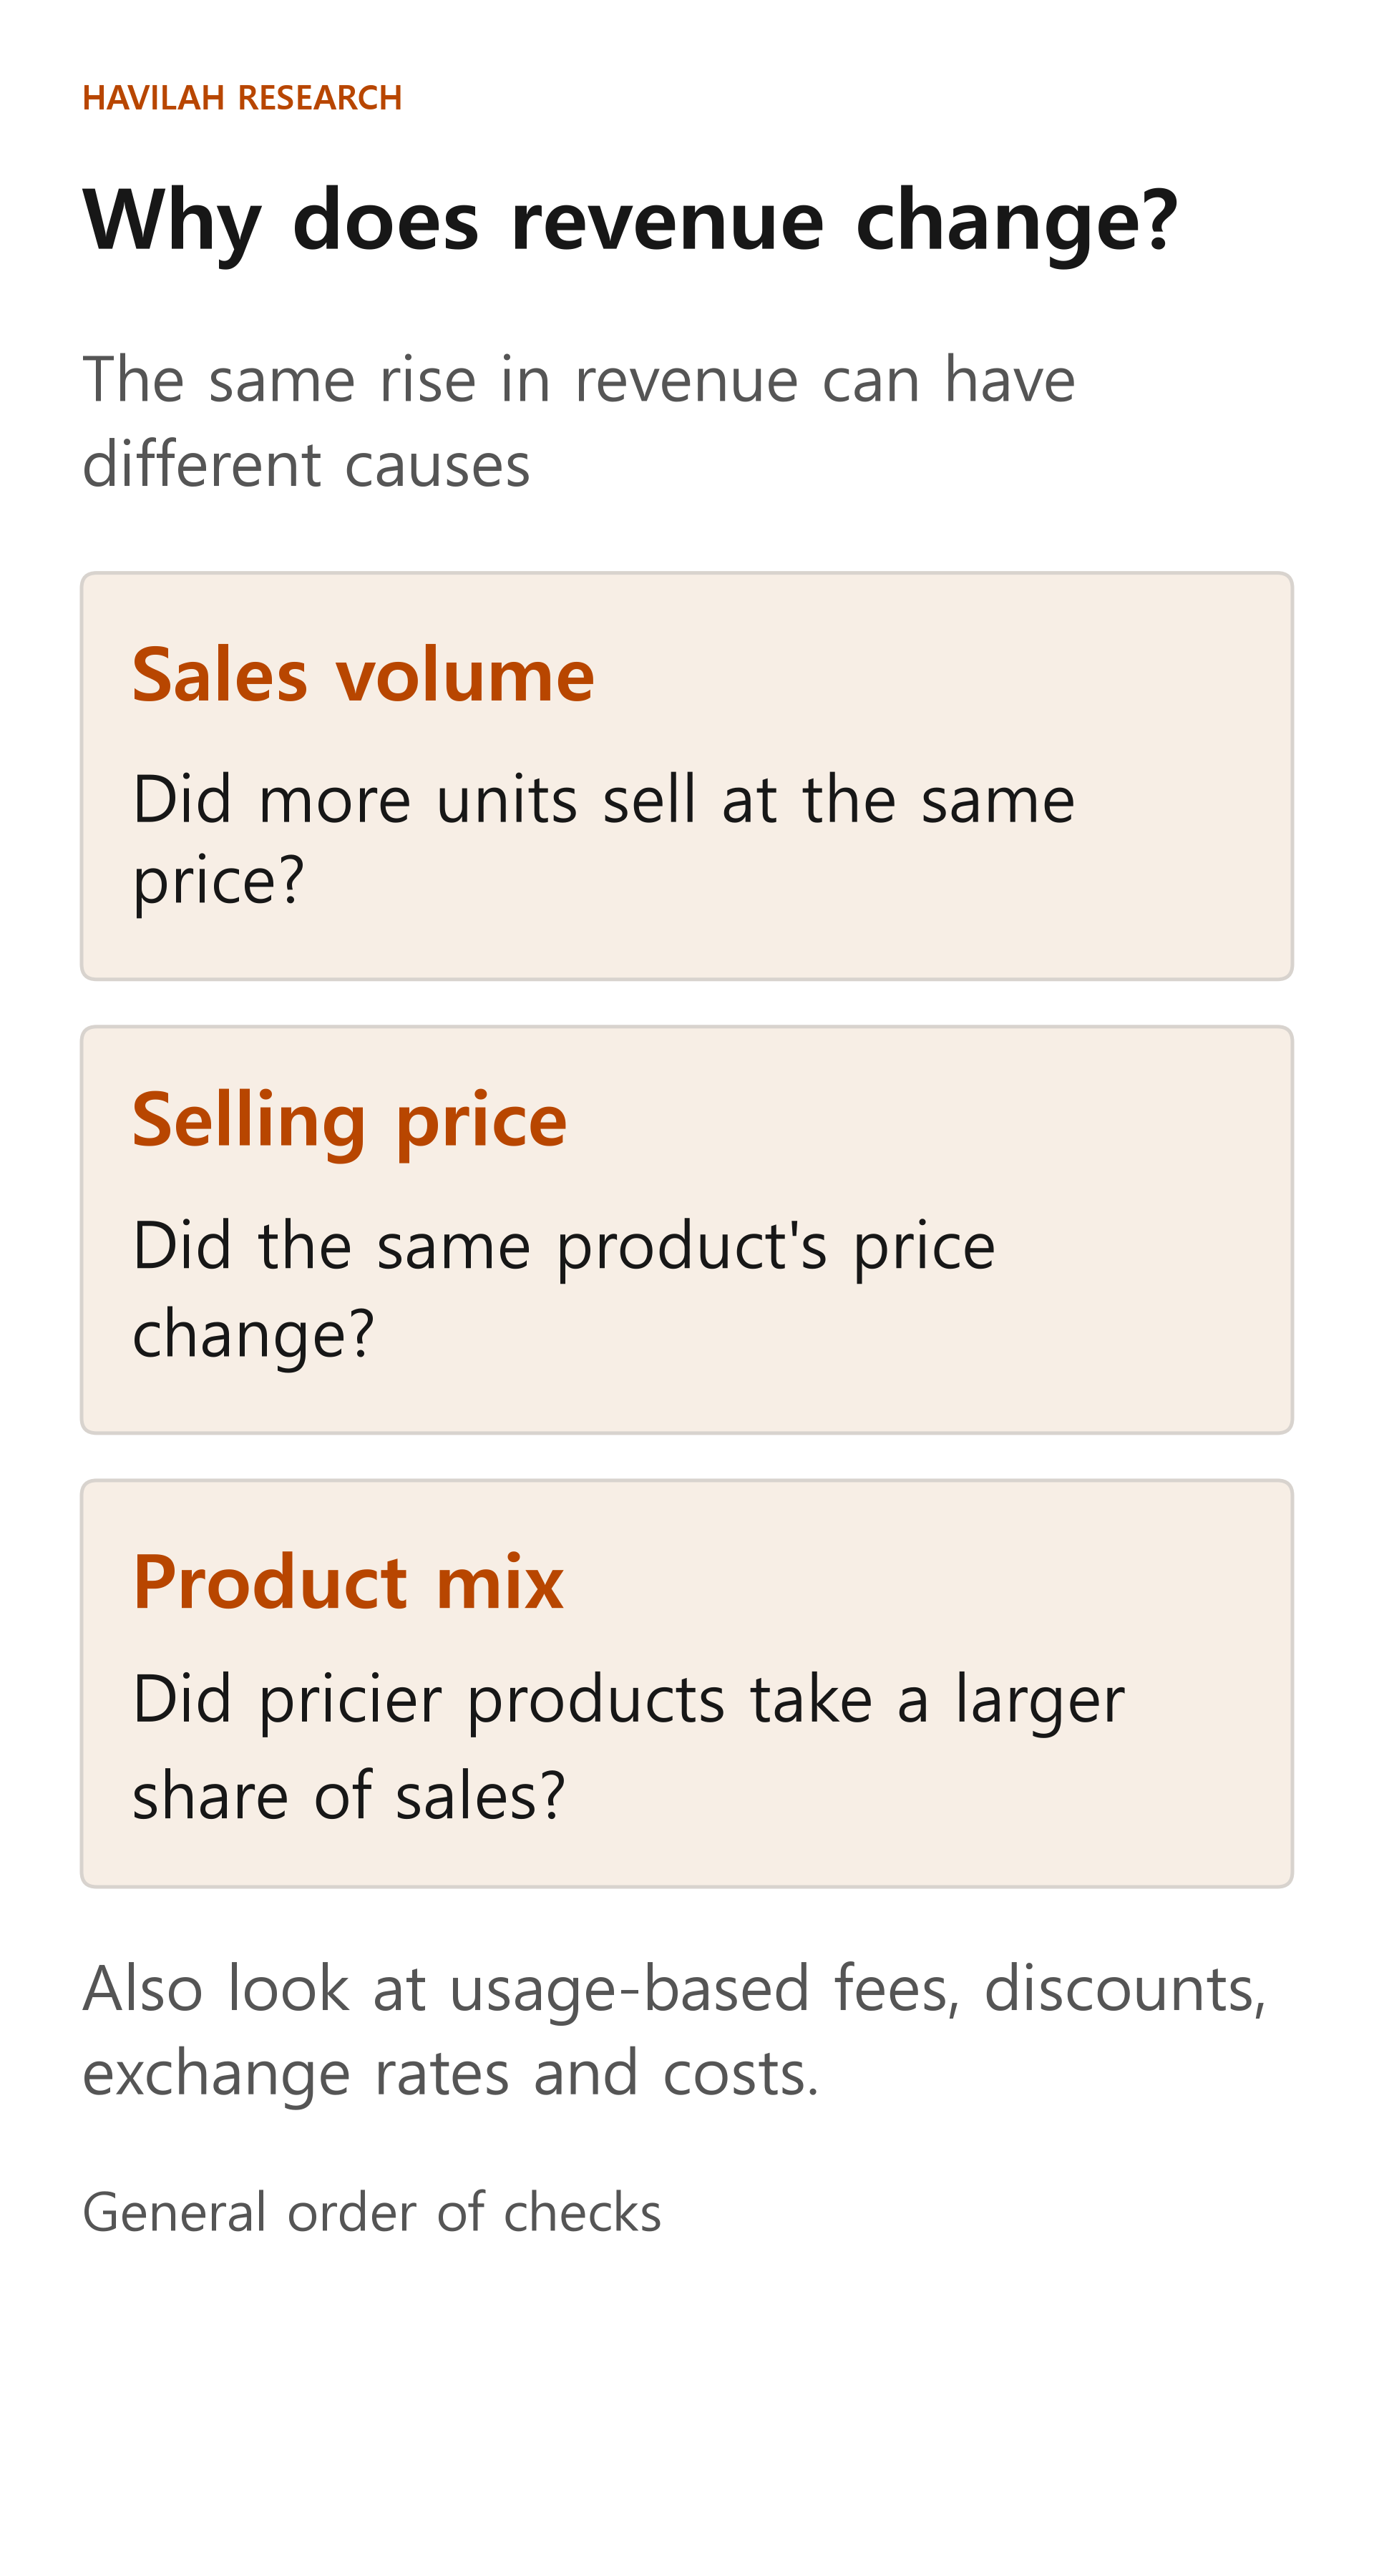
First, find out which of these the company discloses: sales volume, average price, number of customers or usage. Do not look only at the revenue growth rate. Also see which of these the company says affected revenue: price, volume, product mix or exchange rates.
Do not fill in undisclosed numbers with guesses. Even if a price increase lifted revenue, sales volume may fall later, and even if revenue grows, profit can shrink if costs grow faster. When you separate the causes, it becomes clearer what you should check in the next earnings release.