
When a company releases its earnings, revenue and profit are summed up in a few short sentences. If you look for the same results in the 10-Q, you find many more tables and explanations. How do the two differ?
The earnings release is the document a company uses to announce its main results quickly. The 10-Q is a report that contains the quarterly financial statements, management's explanations and more. If you line up the two documents so that they cover the same period on the same basis, you can better understand what the numbers mean.
Start with the numbers the company announced
Let's look at a real example from Apple. On July 30, 2026, Apple announced its results for its fiscal Q3, the quarter that ended on June 27, 2026. The release states that revenue for the quarter was $109.4 billion. A billion is 1,000 million, so $109.4 billion is the same as $109,400 million.
The company said this revenue was up 16% from the same quarter a year earlier. The announcement date and the period in which the results occurred are not the same. This number covers the 3 months through June 27, 2026, and it says nothing certain about how the company is doing after the announcement.
In the 10-Q, match the period and the units
In Apple's 10-Q for the same quarter, revenue is shown as $109,417 million. A figure of 109,417 in millions of dollars is $109,417,000,000. Converted to units of $1 billion, that is $109.417 billion, and rounded to one decimal place it becomes $109.4 billion, the same as in the release.
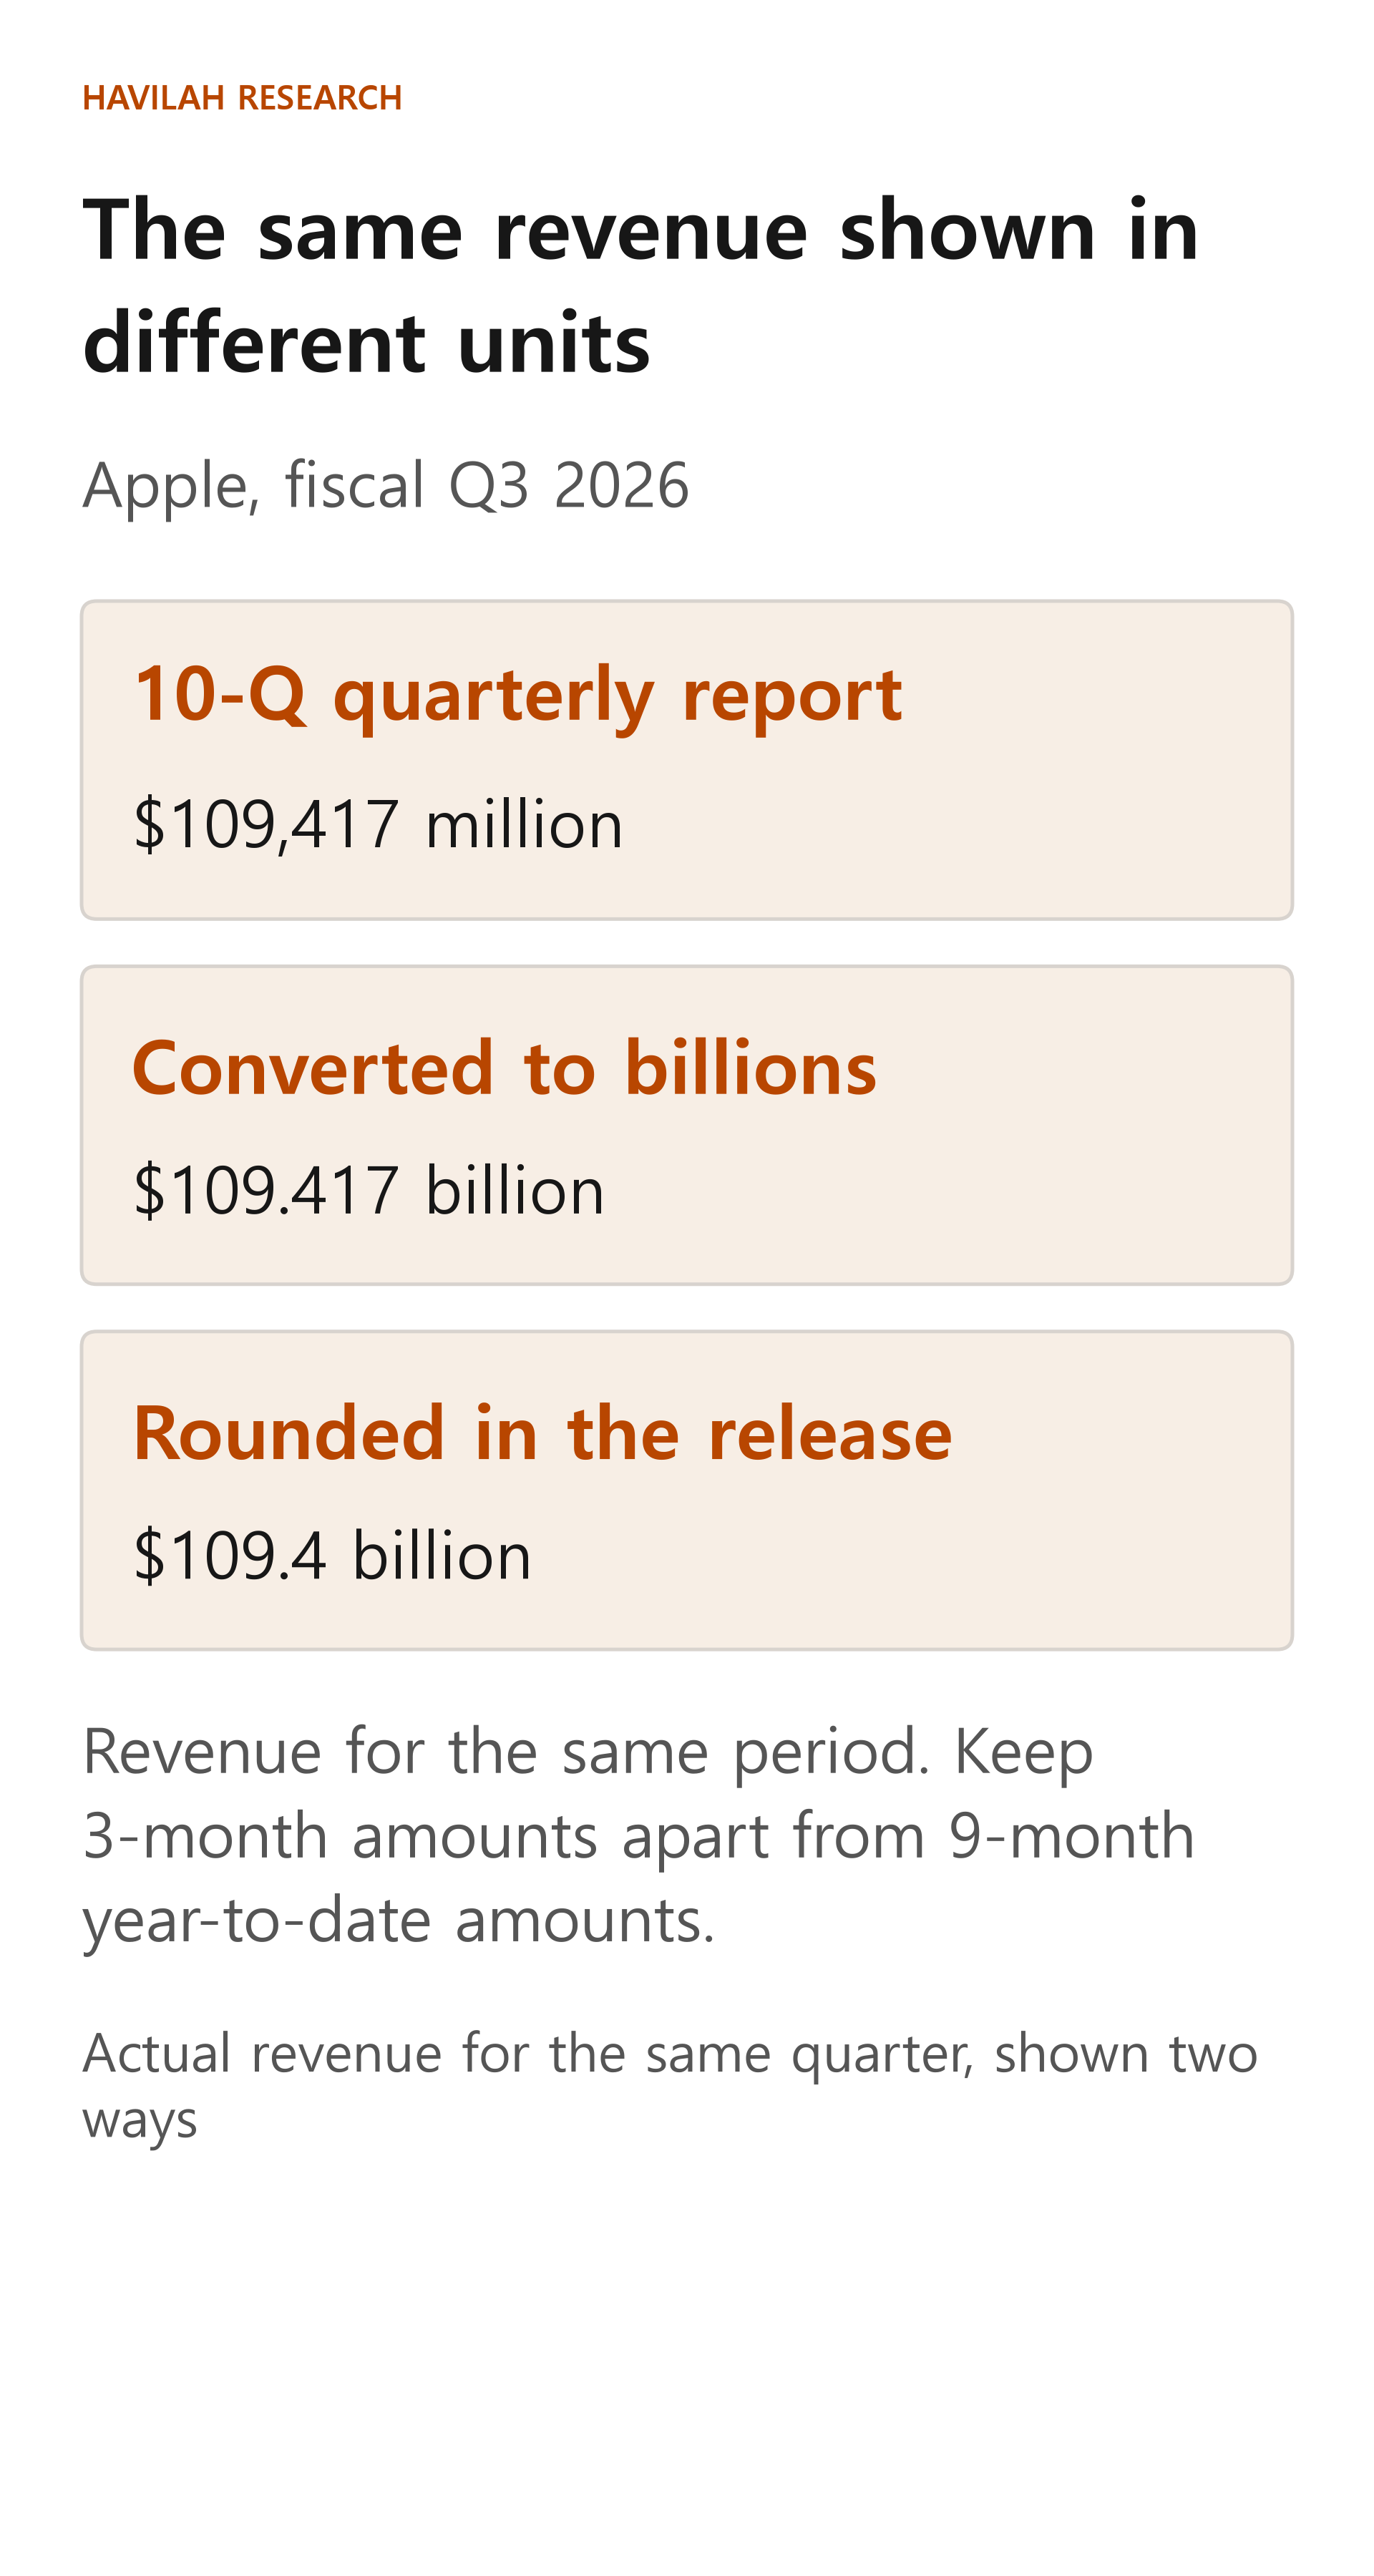
A slightly different presentation does not mean the results are different. First line up the units and the number of decimal places used in rounding. Conversely, even when numbers look similar, you cannot treat them as the same value if the periods or line items being compared differ.
Apple filed this 10-Q on July 31, 2026. Because the earnings release came out on July 30, in this example the quarterly report was filed one day later. Not every company always publishes its documents in the same order or at the same interval.
Tell 3 months apart from 9 months
A 10-Q table may show 3-month and 9-month figures side by side on the same page. In Apple's report, revenue for the 3 months through June 27, 2026 was $109,417 million, and revenue for the 9 months of the fiscal year through that date was $364,357 million.
The 9-month figure is the total of the three quarters since the start of the fiscal year. You should not compare it with the results of the last 3 months alone. When you compare with the previous year, too, compare the 3 months of 2026 with the corresponding 3 months of 2025, and compare the 9-month figure with the prior-year period of the same length.
In the same report, revenue for the corresponding 3 months of the previous year was $94,036 million. The increase is $15,381 million, and dividing it by the prior-year amount gives a growth rate of about 16.36%. The release showed this as 16%. Once you understand that the two documents show a different number of digits, you can compare them more accurately.
Read the explanations next to the numbers
Along with revenue, Apple's release also presented its gross margin and earnings per share. Each of these numbers answers a different question. Revenue is the amount earned from sales. Gross margin is what is left of revenue after subtracting the costs directly incurred in producing the products or services, expressed as a percentage of revenue. Earnings per share (EPS) expresses net income on a per-share basis, taking the number of shares into account.
In the release, the company also said that tariff refunds had a favorable effect on its gross margin and earnings per share. This is why you need to read the fact that the numbers improved separately from the reasons they improved. This release alone cannot tell you whether the effect will recur on the same scale next quarter.
Companies sometimes present their own adjusted figures in addition to the figures prepared under accounting standards. When they do, check which items were excluded or adjusted, and how the adjusted figure differs from the closest figure under the accounting standards. A larger number after adjustment does not mean that the actual costs have disappeared.
The order for reading the two documents together
First, check the revenue, profit and period that the company highlights in its release. Next, find the numbers for the same period, currency and units in the 10-Q, and check whether they are quarterly or year-to-date figures. Then look at management's explanations and the notes to the financial statements for the reasons behind the changes and the conditions attached to them.
This example uses data for one quarter of 2026. If you are analyzing the company now, you need to follow up with the releases and reports that came after it. When numbers look different, rather than deciding right away that there is an error, make a habit of first checking whether the period, the units, the rounding and the basis of calculation are the same.