
When you open an annual report and find dozens of pages, it is hard to know where to begin. You do not need to memorize everything from the start. Begin by connecting three things: how the company makes money, what risks it faces and what results it achieved over the past year.
We will use Apple's fiscal 2025 10-K, which we found in the previous lesson, as our example. This document is historical information about the fiscal year that ended on September 27, 2025. For an investment decision today, you also need to check the reports that came out after it.
Business description: what does it sell to make money?
Business, near the front of the report, explains what products and services the company provides. Apple's report describes products such as smartphones, computers and tablets, along with a range of services.
The question to ask here is simple: "When customers pay this company, what are they buying or using?" Knowing a product's name is different from knowing how much it matters to revenue. For the amounts by product or service, you need to look at the discussion of results and the financial data later in the report.
Risk factors: what could go wrong?
Risk Factors sets out the risks the company considers important. Apple's 2025 report explains, among other things, that competition is intense, that technology changes quickly and that its ability to bring new products and services to market on time matters.
Reading these sentences should not lead you to conclude that a risk has already happened or that the share price is bound to fall. A possibility the company discloses is different from an event that has actually occurred. Instead, you can ask how revenue or costs would be affected if the risk became reality.
For example, if competition forced a company to lower its product prices, the profit left over could shrink even if sales grew. This is a general example to help you understand; it does not assume that this actually happened at Apple.
Management's discussion: why did the numbers change?
MD&A (Management's Discussion and Analysis) is the section in which management explains the company's financial condition and results. Rather than worrying about the long name, remember one question: "What changed compared with last year, and how does the company explain why?"
In its 2025 report, Apple named higher revenue from advertising, the App Store and cloud services as the main reasons its services revenue grew from the year before. This is the company's explanation for that period. Whether the same explanation will hold in the future is something you have to judge separately.
When you look at the numbers, check the period and the units as well. In the report, services revenue for 2025 was $109,158 million and total revenue was $416,161 million. "Millions of dollars" is a unit: every number in the table is counted in units of $1 million.
Services' share of total revenue works out as follows.
109,158 ÷ 416,161 × 100 ≈ 26.23%
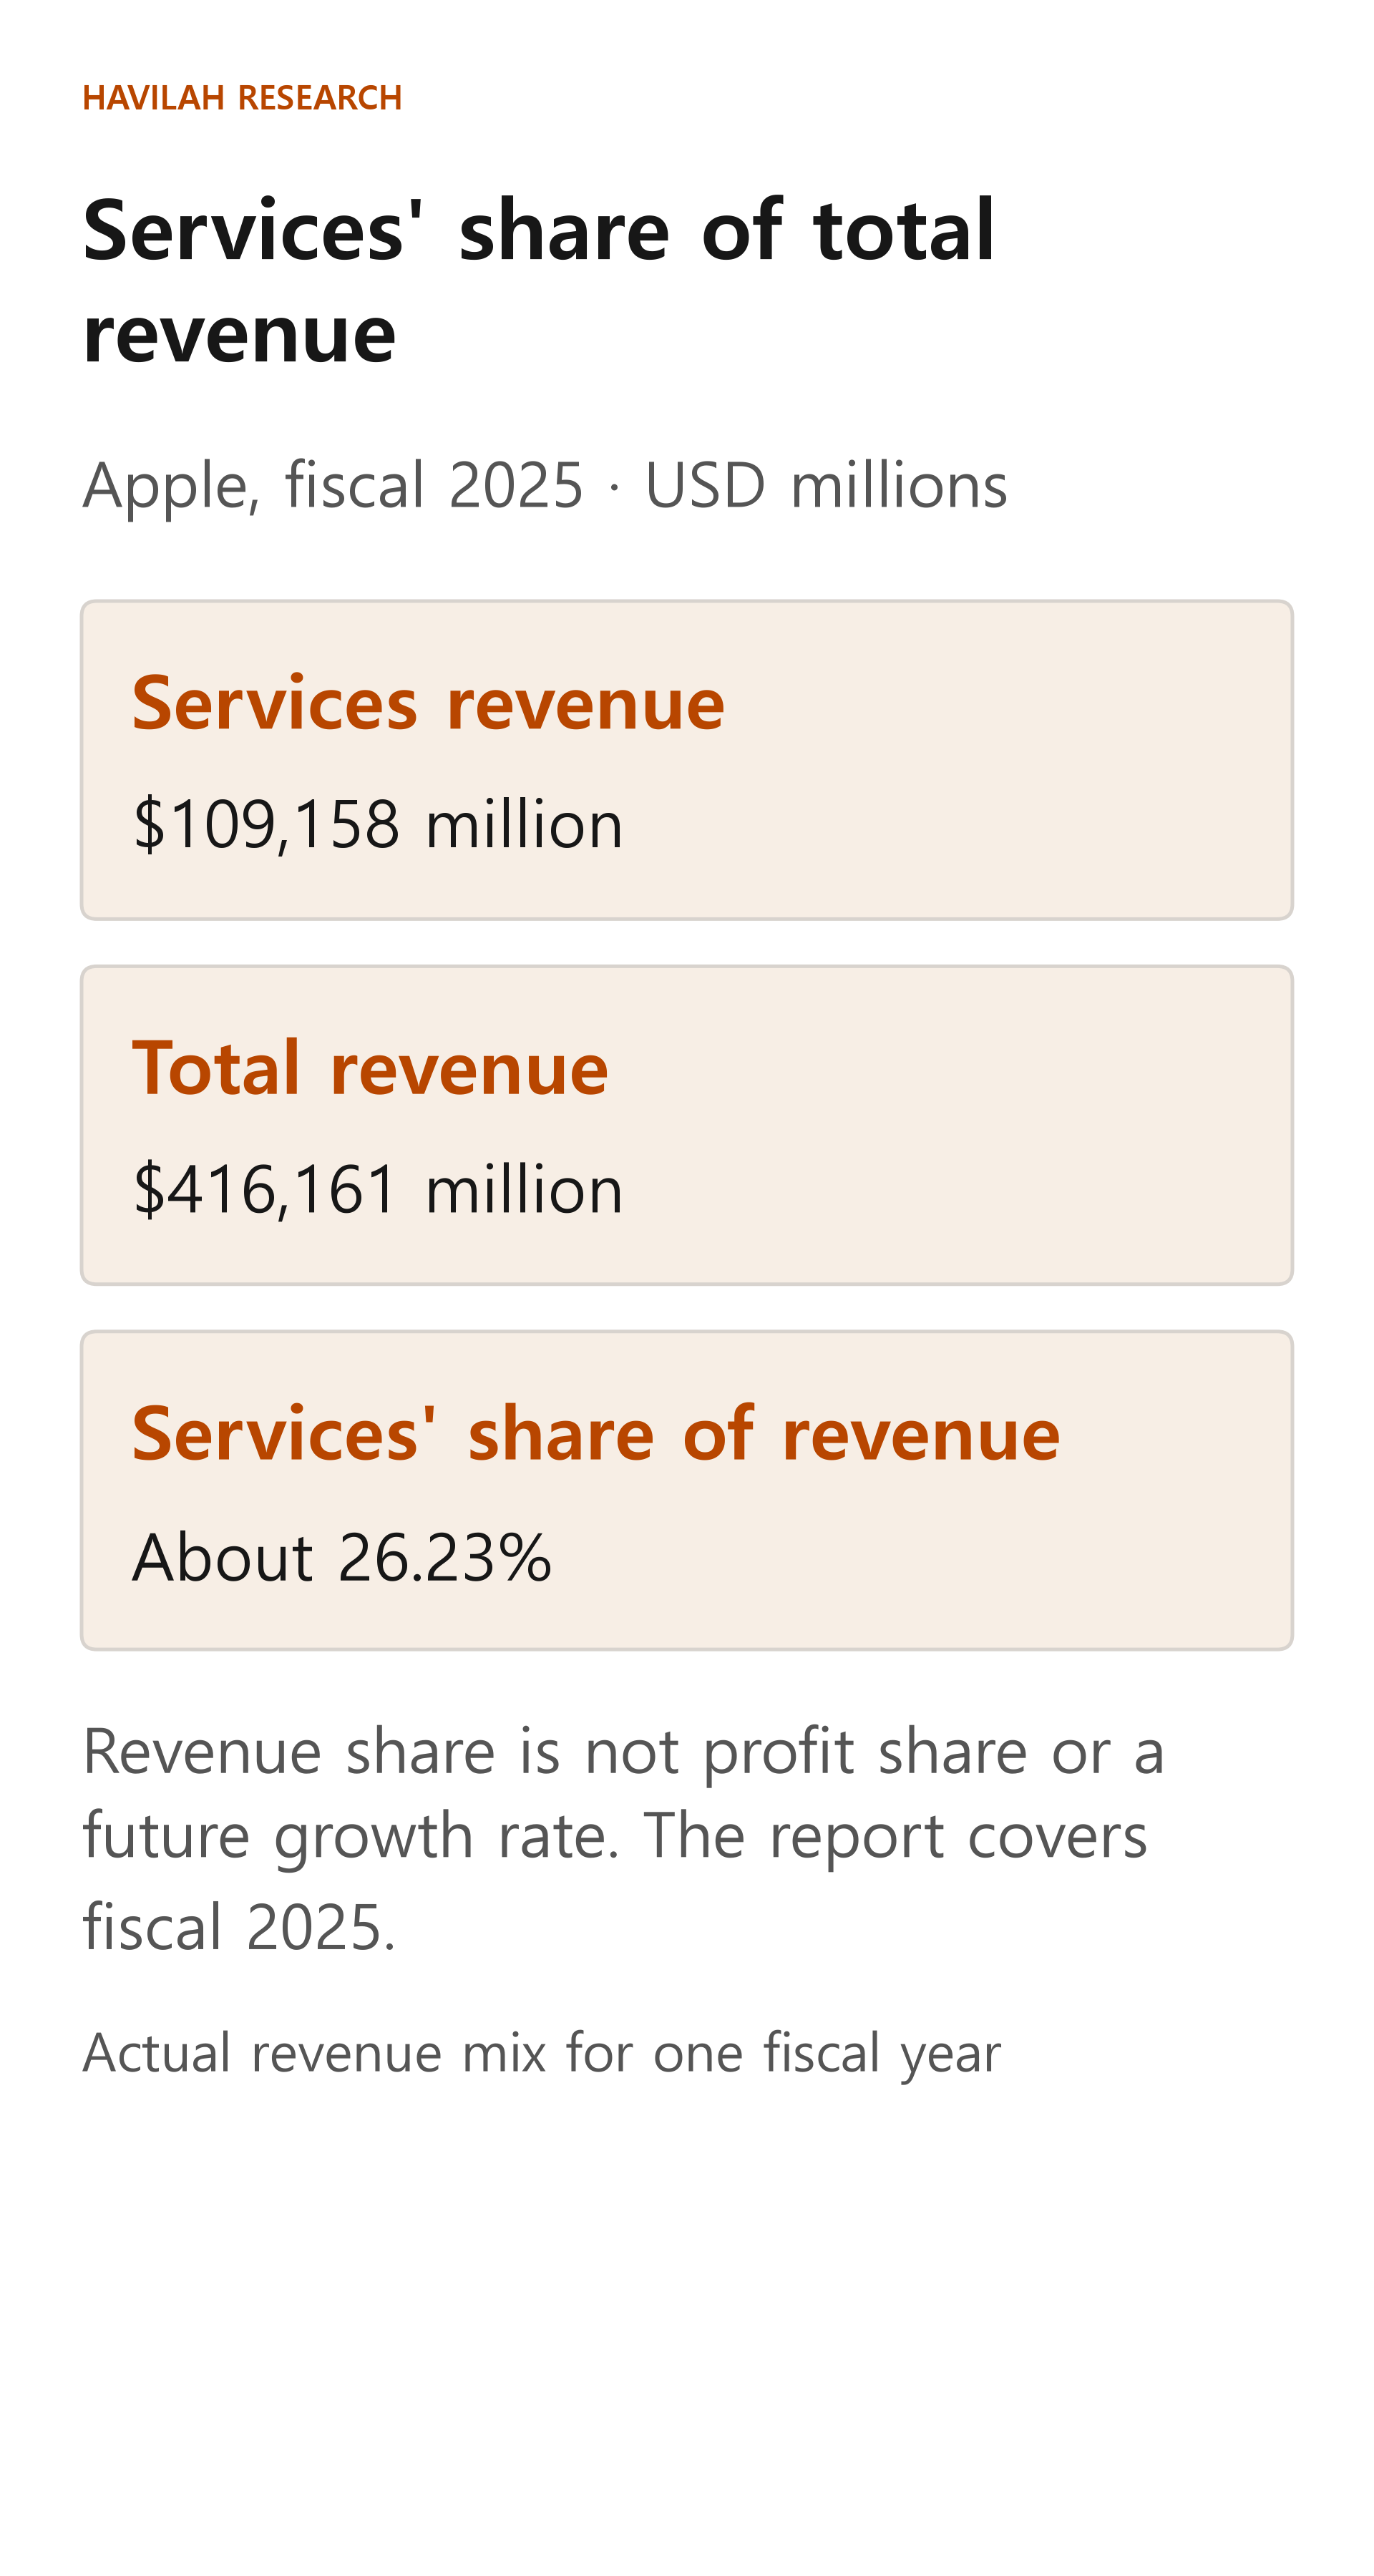
This is services' share of the company's total revenue for that fiscal year. It does not tell you services' share of profit or their future growth rate. You can compare the two numbers this way because they cover the same fiscal year and use the same currency and units.
Financial statements: check the company's results and condition
Financial statements are tables that summarize how money flows through a company and what its financial condition is. At first, try linking each statement's name to a question.
- Income statement: over a period, how much did the company sell, how much did it spend and how much profit was left?
- Balance sheet: at a specific point in time, how much does it own in assets and how much does it owe in liabilities?
- Cash flow statement: over a period, where did cash come from and where did it go?
The income statement and the cash flow statement show flows over a period, while the balance sheet shows the company's position at one point in time. Even when revenue and profit look good, you need to check separately when the cash actually comes in. We will go through how to read each statement step by step in later lessons.
Connecting the four parts sharpens your questions
In the business description, you saw what kinds of services the company offers, and from the results table you calculated services' share of total revenue. Management explained why services revenue grew, and in the risk factors you found competition and technological change.
Now you can ask questions such as "What does the services business need in order to keep growing?" and "How could changes in competition or regulation affect the business?" If you cannot find the answers right away in one document, look for later quarterly reports or other sources and check there.
The annual report is a starting point. When you read the company's explanations, the actual numbers and the risk factors side by side, you can ask more specific questions than a single line of news allows.